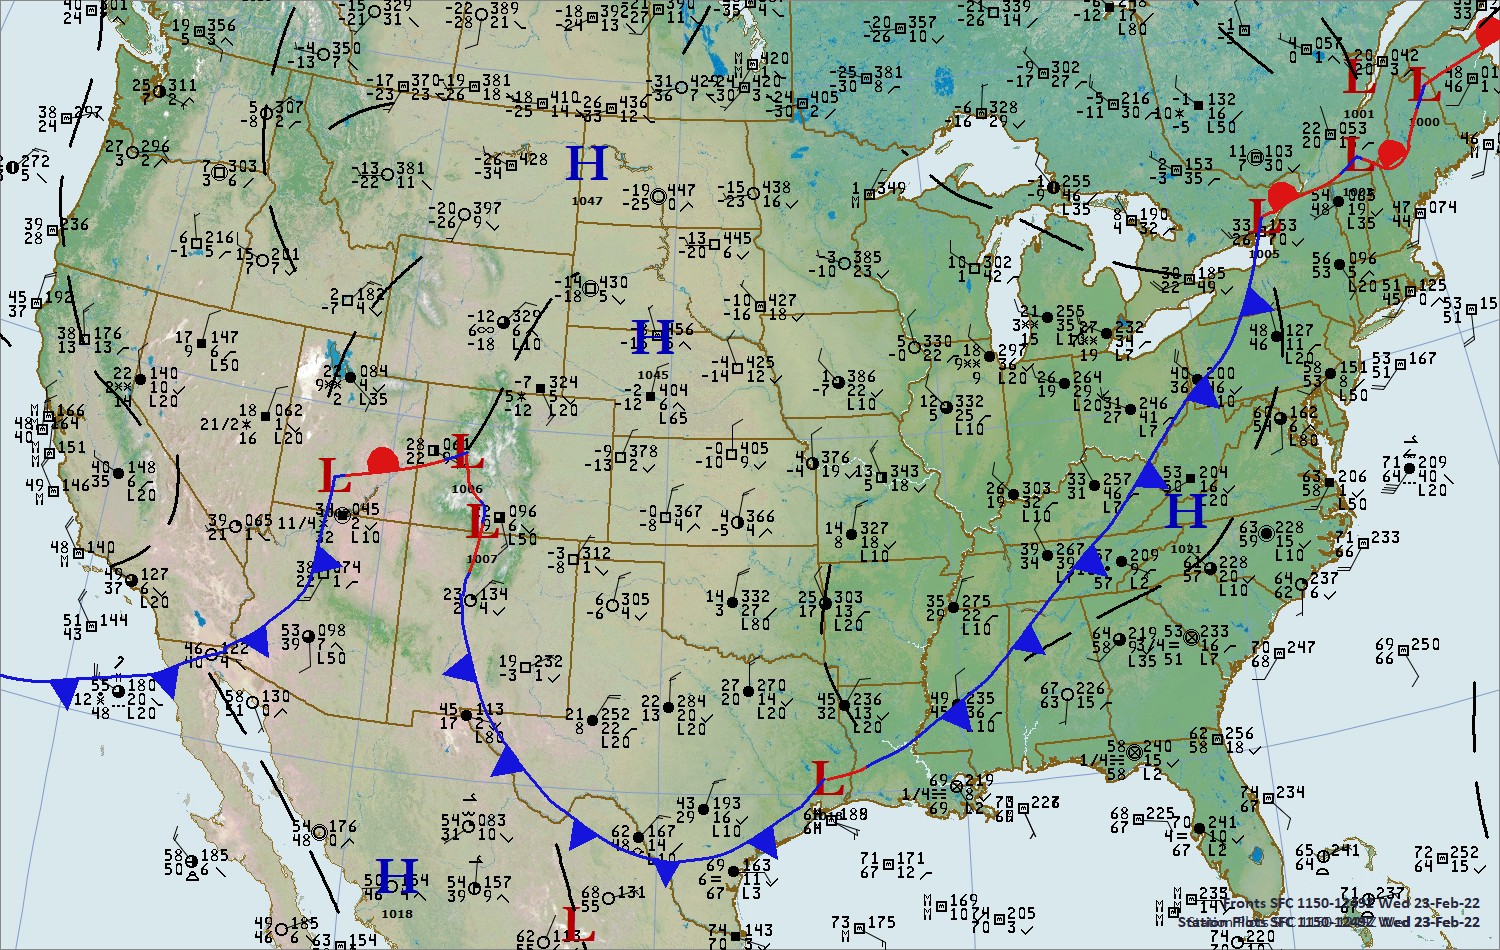
Wednesday, February 23, 2022 at 7:00 a.m. CST
/Continuing with decoding station model plots…
Pick out a few cities and decode their station model plots. If this is your first time, the format for how the data is plotted and interpreted will be found on our home page (just scroll down to below the links to the USA weather web pages).
On the above map the Minneapolis temperature is 3 F, dew point is -10, the sky is clear, and the wind is from the west northwest at 10 mph. The pressure has risen 2.3 mb in the past 3 hours. Knoxville, Tennessee reports 57 degrees F with continuous light rain, the dew point is also 57, the sky is overcast, wind is from the southeast and the pressure is 1020.9 millibars. The cloud ceiling is 200 feet. To learn how to decode these plots go to our home page and scroll down to the station model plot section.
Station Model Plots and the position of fronts and pressure centers. Winds along the cold front in the eastern USA are from the south or southwest ahead of the front and from the northwest behind it. Temperatures drop about 20 degrees across the front. High pressure is centered over the Dakotas. Notice that Bismarck, North Dakota reports -19 degrees F. You will notice a -31 reading in southwest Manitoba. In far south Texas notice the report of fog.
Finally, the streamlines this morning show the surface wind directions across the USA. Notice how the air flows away from high pressure centers and toward low pressure. You will see the air around low pressure centers spirals into the low in a counter-clockwise manner. The air spirals clockwise away from high pressure. Air moving toward a common center of rotation implies there is rising motion and air spreading away from high pressure indications sinking motion.


