Pressure Jumps
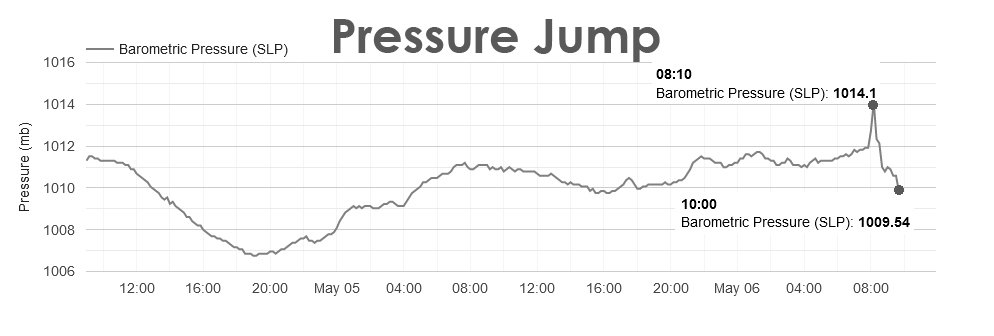
/Pressure jumps are sudden changes in air pressure and are easily seen on a meteograph like the one below. A meteograph is simply a graph of meteorological measurements - such as temperature, dew point, wind speed and direction, or as in this case, air pressure. The air pressure jumped 2 millibars during the 10 minute interval from 8:00 a.m. to 8:10 a.m. shown on this chart. The jump was caused by thunderstorms that moved through the area. The leading edge of the storms included a downdraft of cooler air. It can be felt as a short period of gusty winds that precedes most thunderstorms. Immediately after the leading edge of gusty winds passed the pressure dropped back near where it started. This shows up as the sharp spike in pressure followed by a sharp drop.
The pressure change had two components. There is the overall pressure change caused by the large weather systems affecting the area and also any small disturbances, in this case the thunderstorms. Prior to the spike the pressure was gradually rising. After the spike the pressure dropped just as fast and then began a stronger fall as the thunderstorms moved away. The continued drop in pressure was due to a change in air mass that followed the thunderstorms. The boundary between the original air mass and the new one was a major reason the thunderstorms occurred in the first place.
This is a good example of how an air pressure graph can reveal the changes in air masses and other events that cause long term and short term changes in our weather. By 10:00 a.m. the air pressure was down to 1009.54 millibars which was lower than it was before the storms.
A barograph is an instrument that records pressure changes on a chart.


