One Day Later

We continue to follow the progression of the weather pattern across the United States today.
Note: Learn to read weather maps by learning weather symbol codes and station model plotting schemes here: https://www.weatherbriefing.com/observing-forms

Chilly air associated with surface high pressure covers the eastern U.S., a cold front is moving eastward onto the High Plains, as high pressure builds into the western U.S. 

The high pressure center that was centered over Michigan yesterday has moved to NY and PA as of Noon today. The cold front that was crossing the Rockies yesterday has moved eastward to the Dakotas the Nebraska Panhandle and southwest through Colorado to southern Utah.

A few map features to note:

Using the station model plots found on the surface map it is easy to the cloud cover associated with the lift underway in the storm system over the Plains. Colder air behind the front is also producing cloud cover over parts of the Rockies and Great Basin to the west. Minneapolis was reporting light rain at the observation time. A strong southerly flow is underway from Texas to the Canadian Border in the Upper Midwest. 

SFC_1700Z__10-1-2017_web.jpg

Surface Map, Noon, CDT, Sunday, October 1, 2017; Plotted using Digital Atmosphere, www.weathergraphics.com

The upper air map below shows the air flow over North America today. There is a broad southwesterly flow aloft from the Rockies to the Upper Midwest and western Great Lakes before it turns out of the northwest as it comes around high pressure aloft the ridges from west of Hudson Bay to the Great Lakes south to the Gulf of Mexico. A northwest flow has developed over the Pacific Northwest. 

500 Millibar Map, 7:00 a.m., CDT, Sunday, October 1, 2017; Plotted using Digital Atmosphere, www.weathergraphics.com

500 Millibar Map, 7:00 a.m., CDT, Sunday, October 1, 2017; Plotted using Digital Atmosphere, www.weathergraphics.com

East, West, and in Between

Let's do a little meteorology.

The upper air map (see the first map below) at 500 mb this morning (approx. 18,000 ft) shows a trough over the East Coast of the U.S. and another over the Northern Rockies. A ridge of high pressure is in between.

Large upper air systems (troughs and ridges) usually have reflections at the surface. The trough in the west is associated with a cold front and low pressure in the Rockies and High Plains. The trough along the East Coast is reflected on the surface by low pressure off Rhode Island and Connecticut with a cold front dropping south just off the coast. The surface high over Michigan this afternoon is a reflection of the upper ridge that extends from NW Canada to Lake Winnipeg then south to Louisiana. Upper troughs are associated with rising motion and upper ridges are associated with sinking motion in the atmosphere. 

With sufficient moisture available rising motion creates clouds. Looking at the station model plots on the surface map below we see cloudiness associated with western trough and the eastern trough. 

500H_9-30-17_web.jpg

Upper Air Map, 7 a.m. CDT, 9-30-2017 (Plotted using Digital Atmosphere, www.weathergraphics.com)

Surface Map 5:00 p.m. CDT, 9-30-2017 (Plotted using Digital Atmosphere, www.weathergraphics.com)

Surface Map 5:00 p.m. CDT, 9-30-2017 (Plotted using Digital Atmosphere, www.weathergraphics.com)

Summer vs Autumn

Surface Map Plot, Noon CDT, 9-25-2017Plotted by Digital Atmosphere, www.weathergraphics.com

Surface Map Plot, Noon CDT, 9-25-2017
Plotted by Digital Atmosphere, www.weathergraphics.com

It's that time of year. One day it's summer, the next it is autumn. A stationary front extended from Lake Superior to Iowa and on to the Texas Panhandle at Noon today. Ahead of the front temperatures were in the 80s - definitely summer weather. Behind the front readings dropped into the 70s, 60s, 50s, and 40s.

The map above includes isotherms; dashed lines connecting areas with the same temperature. Notice the tight gradient along and behind the front. The lines are closer together because someone traveling from west to east (east to west) would experience a rapid change in temperature. Traveling parallel to the front someone would experience little or no change in temperature.  The coldest temperatures at Noon were found in Wyoming where readings were in the upper 30s into the 40s. 

This is a good example on how temperature extremes occur. Ahead of the front winds are from the south and southwest. Behind the front winds are northerly. It makes all the difference in the world which side of the front you are on. The colder air has plunged about as far south as the warmer air has moved north. We can expect more days like today during the next several weeks as we move from summer weather into autumn. Gradually the highs won't be as high and the lows will get colder during October and November when next up comes winter.

Snow in September

Edit1-1-0156-2.jpg

Fall streaks descending from cirrus clouds over Cedar Falls, Iowa on September 17, 2017. These streamers are falling ice crystals in sub-freezing air high overhead. The surface temperature was 71 degrees so there was no threat of snow reaching the ground. In fact, the air mass was so dry that the precipitation sublimated - meaning the ice crystals changed directly from ice to vapor in the cold dry air aloft.

Cirrus are precipitating clouds - except the precipitation never reaches the ground. Check out the Weather Briefing Cloud ID Chart. You will see that cirrus are very high. Precipitation would need to fall several miles to reach the ground. It is simply too far to fall before disappearing into thin air as water vapor. 

Great Amercan Solar Eclipse

2017_08_21_0101.jpg

This photo was taken on August 21, 2017, a few miles north of the eclipse centerline in western Nebraska. Our location was a few miles north of the Agate Fossil Beds National Monument in the panhandle. The 70 mile wide umbra, which is the darkest part of the Moon's shadow, has shrouded our location leaving only a relatively bright ring of light hugging the horizon in all directions. With the exception of patchy cumulus clouds in the distance the sky was crystal clear. It was a perfect day for viewing the eclipse. 

Prior to the arrival of the shadow the western sky appeared to be filled with a "dusty" dark haze. It wasn't dust. It was the shadow approaching from Wyoming. We had pulled off a county road and waited. The shadow raced eastward at 1700 miles per hour. As it passed, the sky darkened - stars appeared and the remaining light provided an eerie illumination over the landscape. The change from 99.99% partial eclipse to totality was incredible. It appeared like a dark shroud wrapping is arms around us in an instant. In ring of light encircled us around the horizon - a 360 sunset (or sunrise) - depending on your point of view. In the photo above the darkness can be seen on the ground and in the sky overhead. The ring of light is plainly visible to the north and it completed a circle around the horizon.

Totality lasted more than two minutes. It was an eerie experience but just as suddenly as it arrived it disappeared leaving an instantaneously bright sky with the "dusty shadow" off to the east. Totality was over. The time was just before Noon, Mountain Daylight Time, but you would never know it by looking at this photo. 

Snowstorm in the Upper Midwest

A major snowstorm is moving from the eastern Dakotas into parts of Minnesota, Wisconsin, Illinois and Iowa. Click below to view a video shot just before 7:00 pm CDT in Cedar Falls, Iowa. The snow began at 3:50 pm and there is 1.8 inches on the ground at 7:00 pm. 4 to 8" inches is expected with heavier amounts to the northwest through northeast tonight and tomorrow. The last snow fall here was a trace on March 1st. The last measurable snow was on February 24th when 1.2 inches fell. Click on the button to view the video.

Luminance and Ice Crystals

Sometimes looking at the sky brings surprises. This afternoon we had a very nice example of luminance a relatively rare coloration of the clouds. High clouds were overspreading the sky from the west. The first surge of cloudiness featured cirrocumulus which were painted pink and purple by luminance.  The soft glow of color was caused by sunlight being refracted by ice crystals. The ripples in the cirrocumulus look like waves on a lake or the ocean. In fact the waves are caused by the undulation of the air. The waves move through the air like waves on the ocean. Aircraft flying through these waves get a bumpy ride. 

Cirrocumulus and cirrostratus with luminance - Photo by Craig Johnson

Cirrocumulus and cirrostratus with luminance - Photo by Craig Johnson

The luminance of cirrocumulus was soon followed by cirrus fibratus. These fibers took a dramatic pose against the deep blue of the sky. The fibers are streams of ice crystals brushed over the sky by winds aloft. 

Cirrus fibratus, cirrostratus, and cirrocumulus   photo by Craig Johnson

Cirrus fibratus, cirrostratus, and cirrocumulus   photo by Craig Johnson

Within 30 minutes the sky changed again. Instead of the cirrus fibers a gray pall had overspread the sky. Ice crystals were falling filling the layer with a broad layer of precipitation hiding the more fibrous ice crystals above. The sky was smeared with a diffuse layer of ice without a indistinct base, cirrostratus.

It is amazing how fast our sky can change in a matter of minutes. Try looking up several times a day. The show is free for all attendees. The different cloud types reveal a variety of processes and air movement. Try to imagine what might be causing the different cloud shapes that appear and watch here for more explanations in the future. 

Cirrostratus   photo by Craig Johnson

Cirrostratus   photo by Craig Johnson

Contrail

Contrail

Contrail

Contrails (condensation trails) form in the exhaust of an aircraft engine. Water vapor is one of the by-products of combustion engines and when the exhaust reaches the cold upper atmosphere the water vapor condenses into water droplets and ice crystals. The contrail above has matured from an initial thin trail to this complex looking pattern. Here the contrail has spread into a broader cloud band that includes cirrocumulus and cirrostratus cloud types. The vertical streamers consist of falling ice crystals that form a narrow cloud band.

Altocumulus at Sunset

Altocumulus are "high cumulus". The name originates from "alto," which means "high" and "cumulus" which means heaped. Altocumulus are found in the middle levels of the atmosphere (between 6,000 to 18,000 feet), higher than cumulus which are found in the low levels (below 6,000 feet). Cumulus in the middle levels are therefore altocumulus (high cumulus). 

Cumulus above 18,000 feet are in the cirrus level, a region where temperatures are always below freezing. The clouds consist mainly of ice crystals although water droplets are sometimes found in cirrocumulus, which is the name given to cumulus above 18,000 feet.

In this photo the tops of the altocumulus were illuminated by the setting Sun which helped reveal the vertical structure of the clouds. The photo was taken on the evening of October 5, 2016 at Cedar Falls, Iowa looking northwest. The clouds occurred as moist air in the mid-levels moved into a region of cooler air aloft. The result was an unstable layer that created rising motion in a cellular pattern. The clouds are forming where rising motion cools the air revealing the cloud structure. 

Shelf Cloud

Arcus (Shelf cloud)  looking Northwest from HighWay 20 south of Alden, Iowa, Photo by Craig Johnson

Arcus (Shelf cloud)  looking Northwest from HighWay 20 south of Alden, Iowa, Photo by Craig Johnson

Arcus Cloud - Looking west along Highway 20 south of Alden, Iowa, PHOTO by CRAIG JOHNSON

Arcus Cloud - Looking west along Highway 20 south of Alden, Iowa, PHOTO by CRAIG JOHNSON

Close-up  of Arcus Cloud Looking West along Highway 20 South of Alden, Iowa, PHOTO by CRAIG JOHNSON

Close-up  of Arcus Cloud Looking West along Highway 20 South of Alden, Iowa, PHOTO by CRAIG JOHNSON

Under the Shelf cloud as it moves to the east (Right to Left), PHOTO by CRAIG JOHNSON 

Under the Shelf cloud as it moves to the east (Right to Left), PHOTO by CRAIG JOHNSON 

This magnificent shelf cloud was photographed facing west along Highway 20 south of Alden, Iowa. The date was Friday, September 9, 2016 at about 3:00 in the afternoon. Shelf clouds are part of the cloud grouping known as arcus. These clouds form along the leading edge of the outflow boundary of the thunderstorm. The outflow is the flow of cooler air descending from a thunderstorms. Outflow from above spreading out over the ground undercuts warm moist air drawn into the parent thunderstorm. Arcus clouds are not attached to the parent cloud. The fourth photo in this series is looking north underneath the shelf cloud. Winds gusted to about 45 mph with the passage of this system. 

Mammatus at Sunrise

Mammatus Photo by Craig Johnson taken at Cedar Falls, Iowa

Mammatus Photo by Craig Johnson taken at Cedar Falls, Iowa

This dramatic sunrise is looking east from Cedar Falls, Iowa. Bright yellow light from the setting Sun is illuminating a large field of mammatus clouds. Mammatus form under the anvil of a thunderstorms as air flowing out of the top of the storm is directed downward forming "pockets." Photo taken by Craig Johnson looking east from Cedar Falls, Iowa.

Altocumulus in Formation

Altocumulus forming in bands. The different cloud shapes are caused by differences in the air motions forming each band. Photo by Craig Johnson at Cedar Falls, Iowa.

Altocumulus forming in bands. The different cloud shapes are caused by differences in the air motions forming each band. Photo by Craig Johnson at Cedar Falls, Iowa.

This unusual formation features two bands of altocumulus a ribbon of blue sky with median of scattered altocumulus. The three parallel bands exhibit different cloud processes. On the left is altocumulus stratiformis undulatus. This cloud type displays an undulating flow of ripples in the flow. Note that there appear to be ripples moving left to right at a 90 degree angle to the main flow which is from the bottom to top of the photo. On the far right are altocumulus stratiformis which exhibit more of a cellular pattern of smaller cloud patches surrounded by small clear areas. This indicates different processes are involved in the formation of these two bands In the middle are altocumulus that look like a combination of cellular cloud patches but with an undulating pattern. Generally areas that are clear are regions of sinking air and or air that is not saturated or both.  

Cotton Region Shelter

Cotton Region Shelter - Photo by Craig Johnson

Cotton Region Shelter - Photo by Craig Johnson

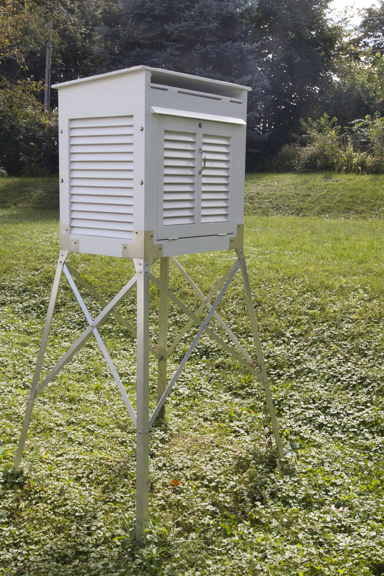
The Cotton Region Shelter is an American adaptation of the original Stevenson Screen which was developed by Thomas Stevenson in 1864. Stevenson was a civil engineer and, incidentally, the father of author Robert Louis Stevenson. Stevenson's small screen (shelter) was modified by Edward Mawley  and adapted by the Royal Meteorological Society in 1884. Stevenson's design included double louvered sides all around.

The American adaptation, called the Cotton Region Shelter, houses thermometers (standard as well as maximum and minimum), a psychrometer or other device to read dew point and relative humidity, and recording thermometers, hygrometers and barometers. The purpose of the shelter is to shield the instrumentation from direct sunlight and precipitation, while allowing a free flow of air. If sunlight shines directly on the sensors the readings will be too high. 

Interior of Cotton Region Shelter - Photo by Craig Johnson

Interior of Cotton Region Shelter - Photo by Craig Johnson

The shelter pictured above meets official National Weather Service standards. Inside are the following instruments; left to right:

  • Transmitter and sensors for remote display of temperature and relative humidity (far left)
  • standard mercury in glass thermometer
  • maximum - minimum thermometers on a Townsend Support
  • a hygrometer
  • sling psychrometer to measure wet-bulb temperature and determine relative humidity and dew point (far right)
  • On the floor of the shelter near the sling psychrometer is a jar with water for the sling psychrometer

The shelter is used for hobby purposes. The standard thermometer and max-min thermometers and sling psychrometer are scientific grade instruments. The dial hygrometer (right corner) and the transmitter and sensors (far left) are consumer grade accuracy. Records are kept using the scientific grade instruments. The front door to the shelter faces north and is opened only when the instruments need to be read. Notice the instruments are kept in the shade by the shelter.

The Cotton Region Shelter has been largely replaced for official measurements in the United States by the MMTS (maximum-minimum temperature system) system. The MMTS began replacing cotton region shelters in the 1980s to eliminate liquid-in-glass thermometers that contained mercury. They were more convenient because readings could be read and reset indoors and the aspirated (ventilated by a fan) shelters with MMTS were more accurate. Today the Cotton Region Shelter is still used by many cooperative NWS weather stations and and still may be purchased. Prior to the 1980s the Cotton Region Shelters were the standard shelters in the United States. 

MMTS Shelter - Photo Courtesy of NOAA

MMTS Shelter - Photo Courtesy of NOAA

The MMTS shelter is aspirated which means air is pulled through the shelter by a ventilation system. This improves the accuracy of the readings. Large objects such as trees, tall bushes, buildings interrupt the flow of air around shelters and can affect the readings of both MMTS and Cotton Region Shelters. 

Minimum Thermometer inside a Cotton Region Shelter - Photo by Craig Johnson

Minimum Thermometer inside a Cotton Region Shelter - Photo by Craig Johnson

The close-up photo above shows the alcohol filled minimum liquid-in-glass thermometer. The black index marks the low point of the temperature since the last reset. The low temperature is read at the right end of the index. The thermometer is reset by tipping the thermometer clockwise allowing the index to slide down to the top of the alcohol. Surface tension of the alcohol stops the sliding index at the current temperature. As the temperature increases the alcohol flows around the index as it expands to the right leaving the index in place where it was reset. When the temperature decreases the alcohol contracts to the left. When it contacts the right end of the index the alcohol drags the index to the left. The alcohol can drag the index to the left but it cannot move the index to the right as the alcohol expands.

Cumulonimbus

Weather Briefing Video

Lightning flashed and thunder rumbled as a strong thunderstorm moved across Black Hawk County, Iowa. The downpour dropped about an inch of rain in 30 minutes with street flooding reported in some areas. At my location the storm was not severe - winds were light, there was no hail, and the rain intensity ranged from moderate to heavy. As the storm moved southeast high winds and hail were reported with numerous severe thunderstorm warnings being issued.

Approaching Thunderstorm

Weather Briefing Video

There is a lot of action along the leading edge of a thunderstorm. Air is flowing into an out of the storm creating many different cloud structures. It's a place of sudden temperature drops with the potential for strong winds as cold air aloft descends to the surface. This storm turned out to be a typical Iowa summer thunderstorm when it crossed Black Hawk County, Iowa. In this case the winds were light at the surface while clouds aloft rushed to the southeast. This video shows cloud formations along the front of the storm and you will see lightning flashes followed by thunder. There was no severe weather here but we did receive about an inch of rain in about 30 minutes.

Ring of Fire

500 millibar Chart from NOAA

500 millibar Chart from NOAA

This upper air chart shows the flow, temperature, dew point depression, 500 mb heights, and centers of high and low pressure, aloft at approximately 18,000 feet. It is approximate because this map shows the height above sea level of the 500 millibar pressure surface...how high above sea level is the 500 millibar pressure surface located. The height is determined by radiosondes - balloons launched at 7:00 p.m. CDT this evening. One of the instruments on the payload package is a barometer - a device that measures air pressure. The air pressure is transmitted back to a ground station along with other data measured by the instruments.

The thin solid dark lines are drawn along lines of equal pressure - 500 millibars. Each line is either 60 meters higher or lower than the next line. Generally speaking the lines in the north are at a lower altitude than ines to the south - changing by 60 meters higher or lower from an adjacent line. 

The closer the lines are together the stronger the winds are at this level. For example the winds aloft, at 500 millibars, are stronger in the northwest corner of the United States than winds over the southern half of the U.S. (There are no lines over the southern U.S., while the lines are close together over the northwestern U.S. One thing we can infer from a map like this is the the flow aloft over the northern U.S. is stronger than over the south with the strongest winds in the U.S. at this height are over the northwest. 

Disturbances in the flow will travel generally west to east across the northern U.S. this week. There is plenty of moisture and warm air blanketing the southern U.S. east of the Rockies and this air will move northward in advance of every disturbance. This means we can expect scattered thunderstorms with most of these disturbances.

This situation is sometimes called the Ring of Fire because a "ring" of thunderstorms develops in the flow on the north side of warm air aloft. If the air aloft is too warm it suppresses thunderstorm development. Cool air aloft associated with the disturbances in the northern flow will help make the air unstable and trigger thunderstorms. The storms create the so-called "Ring of Fire." Watch for thunderstorms this week to form in this flow over the northern United States.