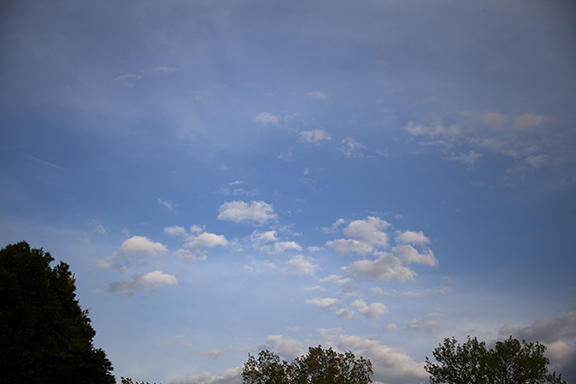
Flying into a Cloud

Even if you have never flown you have probably been inside a cloud. Fog is a cloud that forms near the ground. Walking in fog means you have walked in a cloud. The short (3 second) video above was recorded as we flew while climbing through a cloud layer. It was recorded over south central Iowa as we were climbing toward 25,000 feet. I am not sure how high we were at this point. This cloud was made up of many tiny cloud droplets. At this altitude temperatures were above freezing so there were no ice crystals present.

The smallest rain drops are about .02 inches in diameter and the largest possible drop in a thunderstorms may be about .2 inches. The average cloud droplet is about 100 times smaller than the smallest raindrop. Cloud droplets can be suspended with much smaller vertical velocities than a raindrop. The terminal fall velocity of a small rain drop is about 4.6 miles per hour while the terminal (fastest) velocity of the largest drops is about 20.2 miles per hour. See table here:

http://www.shorstmeyer.com/wxfaqs/float/rdtable.html

Upward air motion of about 4.6 miles per hour would be needed to suspend a small raindrop in the air. In other words, it would not fall. If the upward flow is greater the raindrop would move upward inside the cloud. Larger drops need stronger upward motion to remain suspended. That is why storms with stronger upward motion and large moisture content often have larger rain drops.

Looking down on altocumulus clouds

Flying at 25,000 feet provides more than a birds-eye view of clouds. Click on the video for a 22 second clip showing altocumulus clouds on a trip from Des Moines to Dallas.

The overall scene features long cloud bands from left to right lined up in rows from the top to the bottom of frame. A closer look reveals much more detail. Individual cumulus cells are separated by clear lines perpendicular to the cloud bands. These breaks separate the clouds into cells. Along the bottom of the frame is a cloud band with more of a stratus (layered) structure.

Cumulus clouds indicate instability. Instability can be seen when a cloud forms and its vertical size is the same or greater than its horizontal size. The upward motion causes air to cool and if moisture is sufficient condensation into clouds occurs. Downward motion warms the air and evaporates clouds. Stratus clouds form in a stable atmosphere. The upward motion is much weaker so the rising motion is much weaker. Stratus clouds have a layered appearance because their horizontal size is much greater than the vertical extent.

We see both cloud types here. The left side of the cloud band at the bottom has more of a stratus (layer) shape but there are hints of a cumulus structure too, especially nearer the right half of the band. This show how clouds are not always distinctly separate types. Complex clouds may contain both cumulus and stratus shapes.

Smokey Sky

Smoke over central Iowa, Photo by Craig Johnson

Smoke over central Iowa, Photo by Craig Johnson

This is the setting Sun on June 2, 2019, visible from north of Ames, Iowa. The solar disk can be seen through a layer of smoke that had been hanging over much of Iowa and the northern United States east of the Rockies. The smoke was coming from fires in Canada.

The red/yellow hue is caused by sunlight passing through the smoke layer. The blue end of the light spectrum is being filtered out leaving red and yellow. While the sky looks cloudy, minus the smoke it would be clear. The smoke creates a smooth eerie look and feel to the sky because no cloud bases are visible - just an endless veil of smoke.

Weather in Layers

Photo by Craig Johnson (24 May 2019)

Photo by Craig Johnson (24 May 2019)

Two cloud layers dominate this scene; low and high. The low clouds are stratocumulus seen in the lower half of the photo. Stratocumulus have both stratus (layered) and cumulus (heaped) characteristics. The high layer is cirrus, which is found in the upper 3/4ths of the photo. Cirrus are mostly ice crystal clouds while stratocumulus are made of water droplets. The lower cloud layer is warmer than freezing while the high layer is below freezing. Low clouds are below 6,000 feet, by definition, and the high clouds are above 16,500 feet.

Patchy Clouds

2019_05_24_2379-Edited-WEB.jpg

This lonesome patch of altocumulus appeared in the southeastern sky after several cumulus congestus exited the area. Clouds tell us about the processes going on in the atmosphere. The cumulus congestus indicate stronger vertical motion and greater instability than these altocumulus. A more stable air mass was moving in behind the exiting cumulus congestus leaving much weaker upward motion.

Thunderstorm Footprints on a Barograph

2019_05_24_2371-Edited_WEB.jpg

This is a great example of what happens to barometric pressure during the passage of thunderstorms. During the evening and night of Thursday, May 23rd into Friday morning May 24th several thunderstorms passed our location. Notice the unsteady pressure trace on the barograph beginning around 9:00 p.m. on the 23rd through 8:00 a.m. on the 24th. The pressure falls abruptly before a thunderstorm and rises quickly as the cooler down rush of air reaches and passes the barograph.

Typically the greater the fall-rise couplet the stronger the thunderstorm. Prior to and after the thunderstorms the pressure trace represented the pressure changes associated with the larger scale weather system affecting our area. The smaller scale changes are more dramatic and are superimposed on the larger scale changes.

Gathering Storm

Chaotic Sky - Cedar FAlls, Iowa, by Craig Johnson

Chaotic Sky - Cedar FAlls, Iowa, by Craig Johnson

Gulf moisture surged northward across Iowa on Saturday May 18th setting off showers and thunderstorms. At Cedar Falls 1.17 inches of rain fell between 5:55 p.m. and 9:45 p.m. This photo shows thickening clouds. Darker clouds are seen in the southern sky to the right. They were moving to the north (right to left).

The chaotic sky included two cloud layers; cumulus, cumulus mediocris, cumulus congestus and a second overcast layer of various mid-level clouds. A third layer of cirrus was visible on satellite imagery but not to a ground observer because of the mid-level cloud layer. Rapid vertical development is seen across the lower portion of this photo. The clouds were tilting to the left and upward due to increasing winds with height blowing south to north.

Altocumulus floccus

2019_05_16_2329-Edited-WEB.jpg

Altocumulus means “high cumulus.” Floccus refers to tufts of wool. These mid-level clouds remind us of tufts of wool. They form when the mid-level of the atmosphere is conditionally unstable; meaning if clouds form the heat released by condensing water vapor create clouds with towers - altocumulus. The unstable layer isn’t very deep. In this photo we can see the cloud towers only penetrate a shallow layer overhead. No rain fell and the clouds dissipated. Sometimes these clouds grow large enough to develop into thunderstorms - if the air mass has a deep unstable layer. Photo copyright by Craig Johnson taken in Cedar Falls, Iowa looking west.

Veil of Cirrostratus

2019_04_23_2139-Exposure-WEB.jpg

Cirrostratus over Cedar Falls on April 23, 2019

A sheet of ice in the form of cirrostratus covered part of the sky. A sharp edge to the cloud is a common sight with this cloud type. Cirrostratus always allow the disk of the Sun or Moon to be visible (although not in this photo because the Sun was out of position). If a cloud looks similar to this but blocks the disk of the Sun it is classified as altostratus - a mid-level cloud found between 6,000 and 18,000 feet above the ground.

Winter in April

April 27, 2019 Snowstorm

April 27, 2019 Snowstorm

It was winter in April on the 27th. This photo shows steady light to moderate snow collecting on grassy surfaces. Normally we are done with snow by the middle of April but not this year! A major low pressure center spread snow across northern Iowa. In Cedar Falls the equivalent of 4 inches of snow fell in a few hours, but with never more than an inch on the ground. Thankfully road conditions were only wet here while rural areas to the north reported snow and ice covered roads.

The Tracks of a Blizzard

Barograph, February 24, 2019, Low reading 11 p.m. February 23.

Barograph, February 24, 2019, Low reading 11 p.m. February 23.

A large winter storm formed over the Texas Panhandle and moved northeast through Kansas and crossed eastern Iowa on its way to the upper Great Lakes. The low center exited Iowa near Dubuque after midnight on February 24, 2019. The pressure decreased as the storm approached and began rising after the storm center moved away.

A barograph traces changes in air pressure. The graph above shows the pressure beginning to fall at Noon on Friday, February 22nd. It reached its low point at Cedar Falls, Iowa around 11 p.m. CST on the 23rd. As the pressure began to fall cirrus clouds began increasing from the southwest. The cloud bases lowered throughout the day and night as cloud types changed from cirrus to altostratus. At the same time, temperatures warmed into the low to mid 30s.

As the pressured reached its minimum, the low center was passing southeast of Cedar Falls. With its passage colder air began drifting in from the north and snow began to fall. Winds also increased from the northwest. During the night winds increased and colder air lowered temperatures into the teens. Blowing and falling snow made travel hazardous with travel not advised and some roads in central and north central Iowa became impassible.

Air pressure is determined by many factors. The factors include the total mass of air above our heads, temperature, the amount of water vapor in the air, and whether air is rising or sinking. Those are topics for another occasion. In the meantime, a barograph, like the one in the photo above, is a useful tool for understanding how pressure changes with time how those changes are related to changes in our weather. Barometers were initially used to forecast the approach of storms. Falling pressure meant that a storm was approaching. The rate of fall and how far it fell was related to the intensity and speed of the storm. We have more reliable ways of forecasting the weather today but barometric pressure is still used to monitor storms. The barograph shown above is very useful for anticipating changes in the weather.

Two views of altocumulus

This view is looking southeast at a dramatic looking patch of altocumulus clouds. The clouds were distinct, partly because the light from the Sun, which was shining on the base of the cloud deck. This reveals individual cloud elements that look like pillows. The “pillows” are cells of upward motion where moisture is condensing as water droplets, even though temperatures are below freezing. The droplets are called supercooled.

Photo Copyrighted by Craig Johnson, 2-16-2019

Photo Copyrighted by Craig Johnson, 2-16-2019

Look what happened later. The clouds still exhibit cumulus characteristics, which are puffy cloud elements, but the elements are not as distinct as the clouds begin to look more like stratus (layered) clouds. The Sun has climbed high enough in the sky that it is shining on the cloud tops. The upward motion has been weakening so the clouds are turning into a more consistent layer than one with individual cloud elements. While the clouds in the upper photo are called altocumulus, which means high cumulus the cloud type below is called altocumulus stratiformis. The cloud is becoming increasingly more like a stratus cloud.

Photo copyright by Craig Johnson, 2-16-2019

Photo copyright by Craig Johnson, 2-16-2019

Sun Pillar

There are advantages to cold weather. We had two examples today; a sun pillar and sun dogs. They appeared this morning as the sun inched upward in the southeastern sky. The temperature was near zero as the pillar shown brightly, piercing the snow covered Iowa prairie. Sun pillars occur when sunlight reflects off ice crystals. The crystals are shaped like hexagonal plates and are slowly falling like leaves through the atmosphere. The result was this picturesque pillar.

Sun Pillar, Cedar FAlls, Iowa 2-8-2019

Sun Pillar, Cedar FAlls, Iowa 2-8-2019

Sun Pillar, Photos copyright 2019, Craig Johnson

Sun Pillar, Photos copyright 2019, Craig Johnson

Maximum - Minimum Thermometers

Max-Min Thermometers mounted on a Townsend Support

Max-Min Thermometers mounted on a Townsend Support

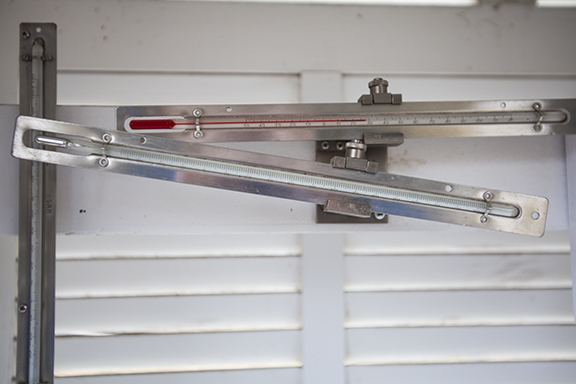
Traditionally maximum and minimum temperatures were measured using the set-up shown in the photo above. Now many weather stations are equipped with electronic instruments. However, there are still many cooperative weather stations using “mercury-in-glass” thermometers. These thermometers, like the lower thermometer above, are mounted on a Townsend Support which places each thermometer in the proper alignment to measure the high (maximum) and low (minimum) temperatures.

The minimum thermometer, on top, uses red colored alcohol as the measuring fluid. Alcohol has a freezing point of -173 degrees F which is much lower than mercury’s -37.9 degrees F. The Townsend Support holds the thermometer tilted down slightly to the left. Inside the tube is a black index which always marks the lowest reading since it was last reset. The index allows alcohol to move past when the temperature warms rises. When the temperature cools the surface tension of the alcohol drags the black index down. Once the temperature reaches its lowest point and begins to warm the alcohol moves up the scale again allowing the marker to remain in place, marking the lowest reading. To reset the thermometer the observer tilts it down to the right and the black index moves down the tube stopping at the current temperature.

The maximum thermometer works like a fluid in glass thermometer used to take your temperature. There is a constriction just above the bulb which allows expanding mercury to move through when temperatures warms but stays in place when readings cool. When the mercury expands (warming) it is forced out of the bulb but when it contracts (cooling) it cannot go back into the bulb. As a result, the mercury stays at the highest point until it is reset by the observer. To reset the maximum thermometer the observer spins it to force the mercury down through the constriction.

The photo above was taken inside a medium size Cotton Region Shelter. The maximum-minimum thermometers are mounted on a cross bar (visible in the photo). The shelter keeps the thermometers in the shade to measure the air temperature, not the temperature of the sun shining on the thermometers, which is what would happened if they were exposed in the open. Sun shining on the thermometers would read too warm. The shelter also keeps the thermometers dry. Wet thermometers would tend to read too cool as water evaporates off them. In the background on the left is a mercury-in-glass thermometer that reads the current temperature. The minimum thermometer also reads the current temperature. The maximum thermometer does not.

Waiting for a White Christmas

Hartman_Reserve_4x6x300_2018_12_16_1965.jpg

Hartman Reserve, Cedar Falls, Iowa

Not every Christmas is white. Even in northern Iowa the odds for a white Christmas are about 6 years out of every 10. It seems like the odds should be higher. So far, this year has provided many opportunities to enjoy the great outdoors without snow and ice. Of course, skiers, snowmobilers, and snow enthusiasts in general have been disappointed - at least in our part of Iowa. However the south through east central and the northwest have had heavy snow already. Some spots in southern Iowa endured up to 17 inches in one storm. We have had 1 inch. But that is life in the Upper Midwest. At some point it will snow. It’s all part of how nature works in the middle latitudes. It’s a bit chaotic but part of the fun of watching the weather is the endless variety we experience. Take time to enjoy watching your weather. Notice the clouds and if you own a rain gauge, thermometer, or barometer read them regularly. Use the links on this website to learn more. It is truly an interesting hobby and there is always something new to learn.

The above photo was taken on Sunday, December 16th. It was a nice day for a walk in Hartman Reserve, Cedar Falls. The only snow and ice was on the frozen creek.

Barograph

A barograph records air pressure on a rotating drum by amplifying pressure change through aneroid capsules. The capsules, which have a vacuum inside, expand and contract with changes in pressure. Multiple capsules amplify the pressure changes as does the arm extending from the capsules which traces the pressure by using an ink-filled nib on the end of the arm. The ink is drawn to the paper by capillary action - much like ink flows from a quill pen.

The barograph below was manufactured by Taylor Instruments. It is a Weather-Hawk Stormoscope Barometer No. 6450. The year this instrument was manufactured is unknown (so far) but they were available at least in the late 1960s and 1970s. There was also a thermograph version that measured temperature.

Barograph_full_2018_12_18_1975-WEB.jpg

Barographs have been superseded by computer displays able to trace pressure change without using ink and paper. Computer systems can also use the pressure data in calculations. Barographs require an observer to read the trace to determine the date and time of the reading. Despite the drawbacks, barographs are still manufactured today and are mostly used for display purposes. Many come in exquisite wood cases and are displayed in cut glass panes. The first barograph was apparently made in the 1760s.

A barograph is a prized possession. Even though there are better ways to record pressure change there is nothing like a high quality barograph to grace a display case. They have the added benefit of letting us see pressure changes as they happen. If you like to do a little forecasting you can also use pressure change with other information, like clouds and wind to make a simple forecast. There is nothing like first-hand learning to encourage someone to get engaged with the world around them.

Graupel

Graupel is precipitation that looks like pith balls. It is caused by snowflakes falling through moist air, such as water-droplet fog that is below freezing or super-cooled* larger drops of water. The water collects on the flakes creating a coating of rime ice. Graupel forms in convection, a condition that occurs when air is unstable. Convection is rapidly rising and sinking air currents. In the warm season convection is what occurs in showers and thunderstorms.

While it might not seem possible, convection occurs cold winter air under the right conditions. It has to do with vertical temperature differences that place heavier air next to lighter air. The heavier air must sink while the lighter air rises, much like a hot air balloon. In summer, temperatures are above freezing at altitudes extending at least several thousand feet above the surface, and often to 10,000 to 14,000 feet high. Precipitation falls as rain. In winter the entire air column is often below freezing so the tiny balls do not melt. The key is not the actual temperature. Convection occurs due to the difference in temperatures. The result is graupel instead of snowflakes.

The balls, about the size of BBs, are easily crushed by squeezing your fingers around them. Pith, is a spongy white material found inside the skin of an orange or lemon and also certain plant stems. While they look like pith balls, graupel is their name. According to Merriam-Webster, the term graupel was first used in an 1889 weather report. The term is Germanic in origin and is the diminutive of Graupe, meaning “pearl barley.” It may look like pith but it is really a form of snow.

Take a look at the photos below showing graupel that fell in Cedar Falls, Iowa on December 4th.

* Supercooled water is water that remains liquid even though temperatures are below freezing. Clouds that are below freezing usually contain liquid water droplets or a mixture of ice crystals and water. The percentage of ice to water changes with temperature. At around -40 degrees clouds are usually all ice crystals.

Graupel_on_Deck_2018_4x6_96dpi_12_04_1938.jpg
Graupel_96_dpi_4x6_2018_12_04_1934.jpg
Graupel_on_tarp_4x6_96dpi_2018_12_04_1937.jpg

Nature's Veil - Cirrostratus

2018_10_24_1914_adjusted-WEB.jpg

Cirrostratus photo by Craig Johnson, Copyright 10-24-2018

Appearing as a smooth whitish veil, this cloud is a distinct example of classic cirrostratus. Milky and smooth, this cloud type may produce a halo, either partial or complete. Often cirrostratus is fibrous with thinner and thicker regions of cloud but true cirrostratus never completely blocks the Sun. The solar disk is always visible, either distinctly if the cloud is very thin or as a very diffuse disk.

Cirrostratus contain ice crystals and are often high enough where temperatures are below zero, even in the summer.

Below you will find a different type of cirrostratus. Taken on the same day about 15 minutes before the photo above this cirrostratus is laced with cirrus fibers around the edges as well as fibers within the cirrostratus itself. Sometimes it is hard to recognize where the cirrus ends and the cirrostratus begins. Identifying clouds can be a tricky process because clouds cannot always be put in nice neat boxes.

Cirrostratus and Cirrus, Cedar Falls, Iowa, Photo by Craig Johnson, Copyright 10-24-2018

Cirrostratus and Cirrus, Cedar Falls, Iowa, Photo by Craig Johnson, Copyright 10-24-2018

Soaring in the Wild Blue Yonder

Photo by Craig Johnson, Copyright 2018

Photo by Craig Johnson, Copyright 2018

Autumn is a great time of year. The humid air of summer gradually retreats from the Upper Midwest. The dry air masses create days of clear skies. This begs the question, “Why is the sky blue?” If you stand on the Moon the sky is black. Here on Earth it is blue. Why? Earth has an atmosphere and the Moon does not.