Clouds of the Day - Tuesday, October 13, 2020

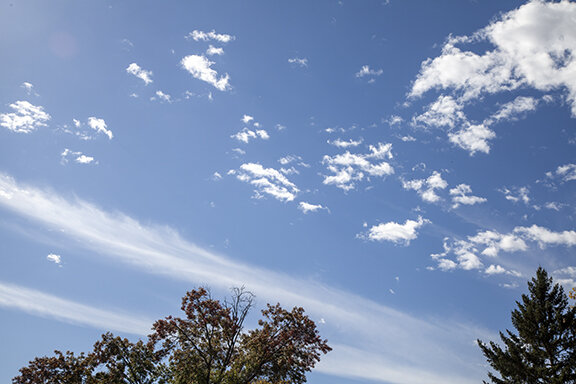
Cumulus and cirrus provide a beautiful background of vertical and horizontal dimensions. The three dimensions of one in the vertical vertical (z) and two in the horizontal (x and y) give us our three dimensional world. Add time and weather displays four dimensions. When observing the weather we are immersed in four dimensions of action. Notice the action in the horizontal and vertical and how it changes with time.

Altocumulus floccus with a band of cirrus in the background.

Altocumulus floccus with a band of cirrus in the background.

A close-up of altocumulus floccus. The floccus looks like flocks of wool.

A close-up of altocumulus floccus. The floccus looks like flocks of wool.

The altocumulus floccus are in the lower left while streaks of cirrus are strung-out along the high altitude jet stream winds aloft. The bands of cirrus dominate the top half of the photo and the lower right. A thin veil of cirrus is visible over th…

The altocumulus floccus are in the lower left while streaks of cirrus are strung-out along the high altitude jet stream winds aloft. The bands of cirrus dominate the top half of the photo and the lower right. A thin veil of cirrus is visible over the top half of the photo while in the lower right are cirrus spissatus (dense cloud patches) trailing streamers of ice crystals.

Clouds of the Day - Sunday, October 11, 2020

Autumn colors and summer cumulus meet on an early October weekend in Iowa. These small cumulus clouds are evidence of weak updrafts forming during the afternoon. While the lower atmosphere, below 5,000 feet, is weakly unstable the air above is stable. The cumulus failed to get any larger than the two clouds in this photo. Small cumulus like these are often referred to as “fair weather” cumulus because they form in an overall stable environment.

2020_10_11_4888_Cu_4x6_96dpi.jpg

WEATHER FROM THE TOP DOWN

As we move deeper into autumn the weather is becoming more energetic. The doldrums of summer are being replaced by stronger winds of the coming cold season. The reason is the increasing contrast in temperatures between the polar north and the warmer air to the south. The first graphic below shows the upper level winds at 35,000 feet this morning. Based on balloon soundings winds greater than 100 mph are found in the red shaded areas. The magenta area nosing into Montana includes winds greater than 150 mph at 35,000 feet. The green includes wind greater than 50 mph.

250H_10-20-2020.jpg

The surface map shows overcast skies in the colder air from the central U.S. to New England, the Great lakes and on to the northern Rockies into Canada. Notice the surface winds in Iowa - from the east and southeast.

USA_SFC_10-20-2020_16Z.JPG

The sounding below from the weather balloon launch at Davenport, Iowa this morning shows the vertical wind speed and direction profiles. On the far right of the chart notice the easterly flow (winds from the east) below 5 thousand feet. The flow is indicated with the wind speed and direction symbols. At 5,000 feet the direction abruptly switches to westerly and increases to greater than 50 mph. The change in direction and speed is called wind shear. I have posted examples of wind shear in the Clouds in Motion section of this website. The shear can be seen in the movement of the clouds.

RAOB_KDVN_10-20-2020_12Z.JPG

CREEPING AUTUMN

Every once-in-awhile I like to throw a little more detail out about our weather situations. During the next two weeks colder air is expected to overspread much of the northwestern and northcentral part of the United States. The beginning of that change is underway now.

The first map below shows the upper level winds near 35,000 feet above the ground. The green shaded areas includes wind speeds greater than 50 knots (58 mph). The red area is greater than 100 knots (115 mph). In the magenta areas winds are approaching 150 mph. Again, keep in mind this is at about 35,000 feet.

The strongest winds are found across the northern one-half of the United States. Notice the curvature in the flow as it drops out of western Canada and turns east across the Northern Rockies and Northern Plains to the Great Lakes. The northerly flow will become established further south as the colder air slides south into the northern United States.

250H_10-14-2020_12Z.JPG

Next we use the same basic map above but instead of showing the flow aloft we super-impose the surface fronts and surface weather reports. Your station model decoding skills will come in handy on this map but if you don’t know how here is how to find the current temperatures in degrees Fahrenheit.

In north central Oklahoma you will see 94 plotted to the upper left of the station circle. That is the current temperature at Enid, Oklahoma, 94 degrees. Now look for the temperatures at individual stations across the map. It is colder in the north with 40s in the northern Plains. The colder air is sinking south behind two surface cold fronts; one from Iowa to Nevada/northern California and the other from Minnesota to Montana. Let’s just say that cold air is creeping into the United States and it’s a sign of things to come.

250H_SFC_10-14-2020_21Z.jpg

Here is a map showing the surface temperatures contoured in color. Notice the temperature plots on the station models.

SFC_Temp_10-14-2020_21Z.JPG

The maps are plotting using Digital Atmosphere software. If you are interested in trying it out go to www.weathergraphics.com. (I receive no money for recommending the software. I just think it is a great tool if you like to plot your own maps.

SATELLITE - SMOKE - HURRICANE DELTA

The visible satellite image from GOES 16 at 2:01 p.m. CDT this afternoon shows hurricane Delta in the Gulf of Mexico, smoke from western wild fires over the Plains and Upper Midwest, and beautiful autumn weather covering much of the nation from the west to the Midwest.

The satellite is stationed in geostationary orbit 22,236 miles above the equator. Photos courtesy of NOAA.

USA_Satellite_VIS_10-09-2020_1400CDT.JPG

The close-up image below shows the smoke blanket covering all or parts of the Dakotas, Nebraska, Kansas into Iowa, Minnesota and the Great Lakes.

UP_MS_VALLEY_10-9-2020_1406CDT.JPG

Smoke can sure travel a long ways from California to Iowa.

Looking southwest from near Fontanelle, Iowa 10-08-2020. The red and yellow hue is due to smoke aloft over southwest Iowa.

Looking southwest from near Fontanelle, Iowa 10-08-2020. The red and yellow hue is due to smoke aloft over southwest Iowa.

Smoke around 2:30 CDT today, looking south-southeast. Notice the thicker white in the direction ofthe Sun on the right side of the photo. This is due to the scattered of sunlight by the smoke. The scattering is stronger when looking toward the Sun.

Smoke around 2:30 CDT today, looking south-southeast. Notice the thicker white in the direction ofthe Sun on the right side of the photo. This is due to the scattered of sunlight by the smoke. The scattering is stronger when looking toward the Sun.

This view looks north in the opposite direction. Notice how the white is not as intense looking away from the Sun.

This view looks north in the opposite direction. Notice how the white is not as intense looking away from the Sun.

How did the smoke get to Iowa? The upp

250H_10-9-2020_12Z.JPG

The upper level winds at 30,000 feet are directly from west to east from California to Iowa. Notice the wind barbs and flags plotting the wind speed and direction on the map. Winds along the path range from about 20 knots to 50 knots (23 to 58 mph). The strongest winds aloft are in the shaded areas where speeds are 75 mph in the green area to more than 100 mph in the red.

175 MPH WINDS AT 32,000 FEET

300_mb_Wind_Speed_12Z_10-7-2020.JPG

The map above is the a chart showing weather conditions at 32,000 feet this morning, Wednesday, October 7, 2020 at 7:00 a.m. CDT (1200Z). The data comes from a weather balloons launched at the stations plotted on the map. The shaded areas show where the strongest winds were blowing.

The radiosonde station weather balloon station at Gaylord, Michigan reported winds at 32,000 feet were nearly 175 mph as measured by a weather balloon. The strongest winds were in the red and magenta areas. The core of the jet stream is running from northern Minnesota to western New York State.

This is not an unusual wind speed at high altitudes but such speeds only occur in the core of the jet stream. By contrast, wind speeds in the southwestern United States ranges from less than 10 mph to about 25 mph. The location of the jet stream is important for weather in the middle latitudes. The jet stream contains the strongest winds in the westerlies that circle the globe in the middle latitudes of the northern and southern hemispheres. The jet stream determines the location of storms and regions of fair weather.

Just for the fun of it, check out the air temperatures on this chart. For example, the upper air temperature at North Platte, Nebraska is -47 degrees Celsius at 10,880 meters (35,695 feet).

Clouds of the Day - Thursday, October 1, 2020

Sometimes it is difficult to determine the difference between altocumulus and stratocumulus. This is especially true when the stratocumulus and altocumulus are near 6,500 feet - the demarcation line between low and middle cloud families. First of all, remember you are making an estimate of the cloud height by their appearance. Your best guide is your experience in comparing the size of the cloud elements. Altocumulus cloud elements are smaller than stratocumulus. The size of the cloud elements in the photos below suggests they should be categorized as stratocumulus but it is somewhat of a guess.

Stratocumulus

Stratocumulus

Stratocumulus

Stratocumulus

Stratocumulus

Stratocumulus

Stratocumulus

Stratocumulus

Clouds of the Day - Tuesday, September 29, 2020

Stratocumulus are in the low cloud family. The cloud elements are fairly large when compared with the higher altocumulus found in the middle levels.

Stratocumulus

Stratocumulus

Stratocumulus

Stratocumulus

Cirrostratus clouds often produce haloes as shown below. The halo photos here show only a portion of a circular halo that was around the Sun. The sunlight is being refracted (bent) by the ice crystals in the cirrus clouds.

Cirrostratus with halo

Cirrostratus with halo

Cirrostratus

Cirrostratus

Cirrostratus with halo

Cirrostratus with halo

Cirrostratus with halo

Cirrostratus with halo

This photo illustrates how tough it can be to distinguish cloud types. There are likely three types blended together in the photo below. What we need to remember is cloud names help us distinguish cloud heights and the process that are forming the clouds. While we have specific names for clouds it can often be tough to distinguish differences. Clouds form in a continuum - not necessarily is discrete types so we often have types that are intermingled.

Cirrus (top), cirrostratus (middle), altostratus (bottom).

Cirrus (top), cirrostratus (middle), altostratus (bottom).

Decode the Surface Weather Map

Here is the surface weather map from 1800Z (1:00 p.m. CDT) this afternoon. Locate the following: cold fronts, warm fronts, stationary fronts, and troughs. The thin black lines are the isobars (lines of the same pressure). Decode the current weather from the weather stations of your choice. For help go to our home page and click on the Decoding Map to learn more.

Chicago, IL observation: Temperature 78F, Dew point 54F, Wind from the south at 10 knots, Pressure was rising and now is falling - down 1.4 mb in the past 3 hours, Pressure is 1014.1 mb. the sky has scattered clouds. Where are centers of high and low pressure? The wind will be strongest where the isobars are closest together.

USA_SFC_FRI_9-25-2020_18Z.JPG

Wildfire Smoke - Sunday, September 13, 2020

Smoke from wildfires in the western United States covers much of the western half of the United States. Today a thin band of smoke extended from southwest to northeast Iowa. Cedar Falls, Iowa was on the northern edge of this band that was about 30 miles wide. The photos below tell the story.

Looking south directly into the smoke cloud.

Looking south directly into the smoke cloud.

Looking south southwest.

Looking south southwest.

Looking south southeast under the smoke. Near the bottom of this photo a thin line of blue is visible. This is the blue sky near the southern edge of the smoke.

Looking south southeast under the smoke. Near the bottom of this photo a thin line of blue is visible. This is the blue sky near the southern edge of the smoke.

This is looking to the northwest. The right side of the photo is to the north away from the smoke - the sky is blue. The edge of the smoke is visible in the upper left quarter of the photo. From there to the south (as shown in the other photos) the …

This is looking to the northwest. The right side of the photo is to the north away from the smoke - the sky is blue. The edge of the smoke is visible in the upper left quarter of the photo. From there to the south (as shown in the other photos) the sky was covered with smoke.