Following a Cold Front
/Yesterday's post showed a cold front from Hudson Bay into southcentral Canada and then northwestward parallel to the mountains in western Canada. Today that front has moved to eastern Hudson Bay to Lake Superior, South Dakota, then northwestward across Montana into southwest Canada. The polar front we were watching was stretched across the southern United States.
These fronts form in the middle latitudes where temperature contrasts from north to south create traveling cyclones (low pressure) and anti-cyclones (high pressure). The flow of these systems is a major part of managing the Earth's heat budget, bringing warm air north and cold air south to dissipate the middle latitude temperature differences. More about that in a different post.
For now we can say the arctic front continues to move southeastward with its air mass being modified by warmer ground, longer days, and mixing with warmer air. Ahead of the front warmer air is moving north to be cooled by colder land and water, shorter days, and mixing.
Surface Weather Map, Wednesday, November 8, 3:00 p.m. CST. Map plotted by Digital Atmosphere available here: http://www.weathergraphics.com/
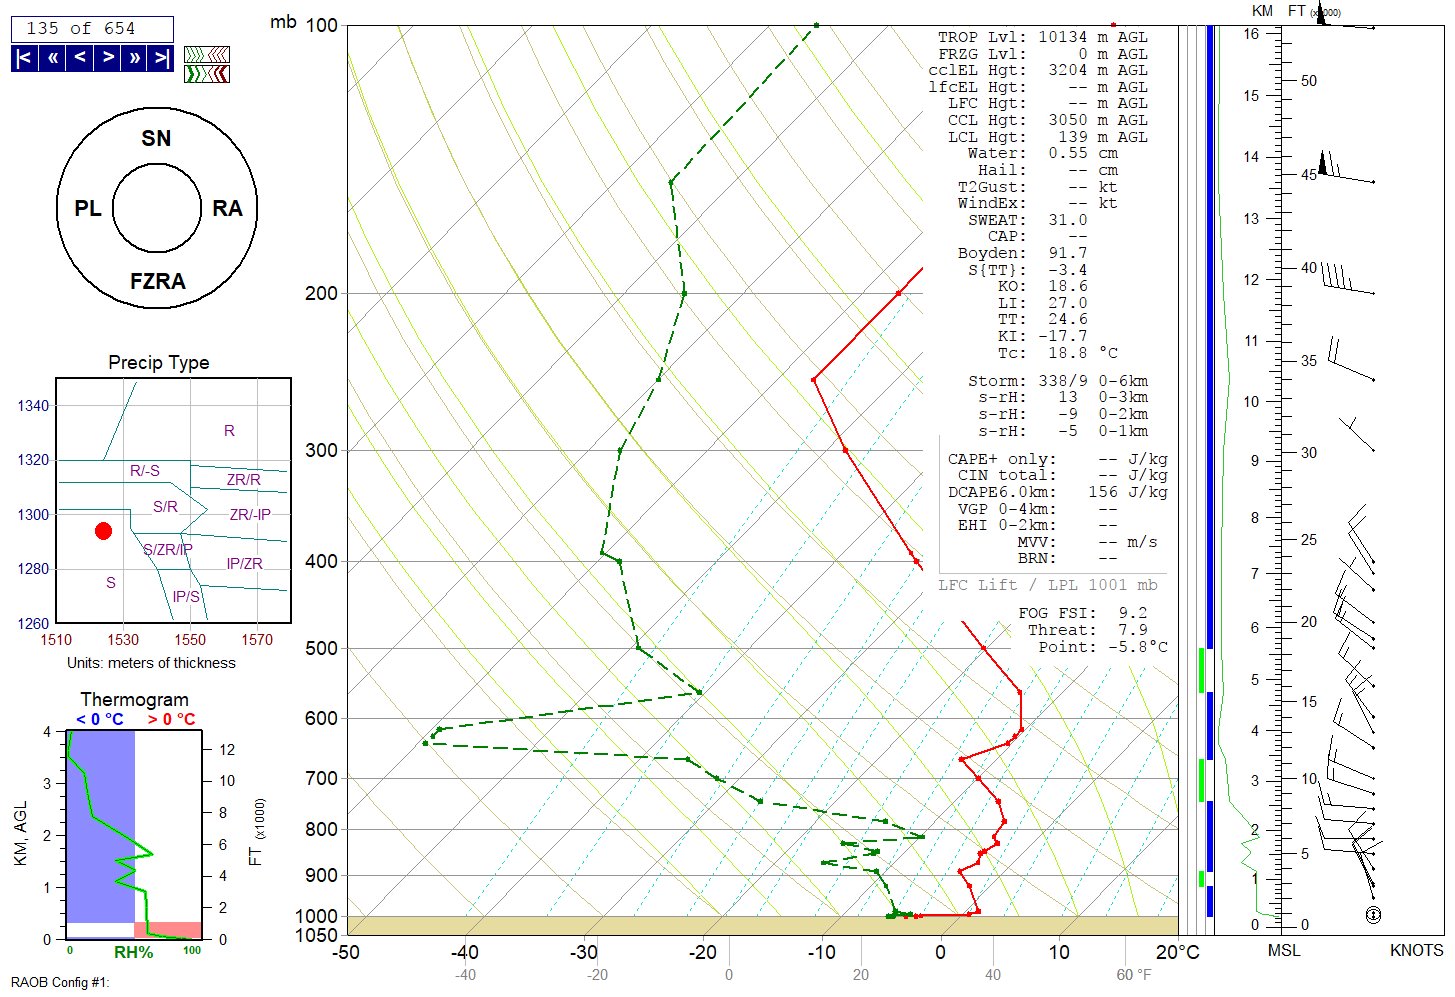
For those of you who like to delve in to the science of all this, below you will find what is called a RAOB (RAwinsonde OBservation). It is a sounding of the atmosphere made by an unmanned balloon which radios data back to earth as the balloon ascends. This sounding is from Davenport, Iowa at 6:00 a.m. CST today. It shows a dry air mass with the red line (temperature plot) and green dashed line (dew point). The spread between the two lines is substantial, indicating dry air. The greater the difference between the temperature and the dew point temperature the lower the relative humidity. In this case the dry air is sufficient to prevent precipitation as the cold front moves southeast across eastern Iowa. There is a lot more to this chart so I am going to leave it at that for now but it is one tool used by meteorologists to gauge what is happening in the air over our heads.
RAOB Sounding Plotted by the RAOB Program available here: http://raob.com/
How often are balloons launched? Weather balloons are launched twice per day, 6:00 a.m. and 6:00 p.m. CST (7:00 a.m. and 7:00 p.m. EST and so on around the world). The balloons are launched simultaneously worldwide, at least twice daily, to measure upper air conditions including temperature, dew point, and wind. More than 200 other parameters are computed and plotted from these basic measurements. The chart about shows the temperature, dew point, and wind profiles (changes with height).
.Learn about weather balloons and how they are launched by clicking here. Where are the weather balloons launched i the USA? Check this website from NOAA. The launches are scheduled twice daily. Additional launches may be requested as the weather demands.


