Impressed?

Photo Courtesy of NOAA/National Weather Service, GOES-16, January 2018

Photo Courtesy of NOAA/National Weather Service, GOES-16, January 2018

I am!

Intense (called a "Bomb" Cyclone) low pressure moving up the East Coast leaves a trail of new snow visible on the ground from SE Georgia to South Carolina, and eastern North Carolina. These storms are extra-tropical cyclones (meaning they are outside of the tropics). It has a well defined center located in the tight curl wrapped up off the east coast but these storms are NOT formed in the same way as hurricanes. In fact, strong winds aloft are part of the ingredients that cause these storms in the first place. Hurricanes (tropical storms) are ripped apart by strong winds aloft. 

Midwest March Snowfall

2018_03_24_1033_Snow_on_branches-WEB.jpg

Photo by Craig Johnson - Cedar Falls, Iowa, 3-24-2018

Yesterday's snowstorm dropped 10 inches of snow on Cedar Falls. Not only was there a lot of snow, the snow was very heavy. The snow had a layer of slush at the bottom because of large water content and temperatures that were a little above freezing as the snow fell. At the snow melted the layer of slush at the bottom became deeper.

The above photo shows wet heavy snow stuck on branches. The branches hung low due to the added weight. The next time it snows notice the weight of the snow. Snow's water content tends to be less when temperatures are colder. Therefore the snow is easier to shovel. Wet snow can be very difficult to shovel because of its high moisture content. In our case even two stage snow blowers had a tough time trying to blow the snow. They are made to blow snow flakes not slush.

Altostratus from below

Altostratus photo taken by Craig Johnson in Fort Dodge, Iowa, 10:45 A.M. ON 3-23-2018

Altostratus photo taken by Craig Johnson in Fort Dodge, Iowa, 10:45 A.M. ON 3-23-2018

Altostratus is a mid-level cloud identified by its height, between 6,000 feet and 18,000 feet, and its generally smooth layered appearance. Sometimes the cloud has a diffuse base like shown here. In this case the Sun is dimly visible but altostratus often obscures the Sun's disk. Altostratus is not a precipitating cloud. This cloud formed in a layer of gentle upward motion that developed in advance of a winter storm moving eastward from the Rockies. The storm emerged on the Plains as a low center in Kansas and moved east. Heavy snow fell in parts of southern Minnesota and northeastern Iowa. 

The map below was plotted from observations taken at 11:00 a.m. CDT on March 23, 2018. At that time the low center was reorganizing from Wyoming into northwestern Kansas. Notice the closed oval isobar enclosing eastern Wyoming, the Nebraska Panhandle, northeastern Colorado, and far western Kansas. By early evening the low center had formed over northwestern Kansas. The altostratus over Fort Dodge, Iowa was in a band that extended from northwest into southeast Iowa. The bases were above 12,000 feet. Lower clouds were located over western North Dakota southeastward to St. Louis. The ceiling at Des Moines, Iowa was at 7,000 feet (C70)* while ceilings in western North Dakota and eastern South Dakota were below 3,000 feet (C27, C28, C25)*. 

The ceilings are plotted on the station model. Red indicates ceilings below 3,000 feet. Clouds above 12,000 feet are not plotted.

USA Surface Map: 11:00 a.m. CDT., March 23, 2018. Map plotted by Digital Atmosphere Software available at www.weathergraphics.com

USA Surface Map: 11:00 a.m. CDT., March 23, 2018. Map plotted by Digital Atmosphere Software available at www.weathergraphics.com

Altostratus up close

Climbing through altostratus northeast of Phoenix, Arizona - Photo by Craig Johnson ON February 13, 2018

Climbing through altostratus northeast of Phoenix, Arizona - Photo by Craig Johnson ON February 13, 2018

Climbing out of Phoenix on an American Airlines flight to Des Moines, we passed through scattered cumulus clouds (visible below) before reaching what appeared to be a well defined altostratus layer. As we approached the cloud base it became apparent the cloud base was diffuse - not distinct. The altostratus looks like fog covering roughly the top half of the photo. The lower clouds look indistinct because we were climbing into a thicker cloud layer which eventually obscured the lower clouds. 

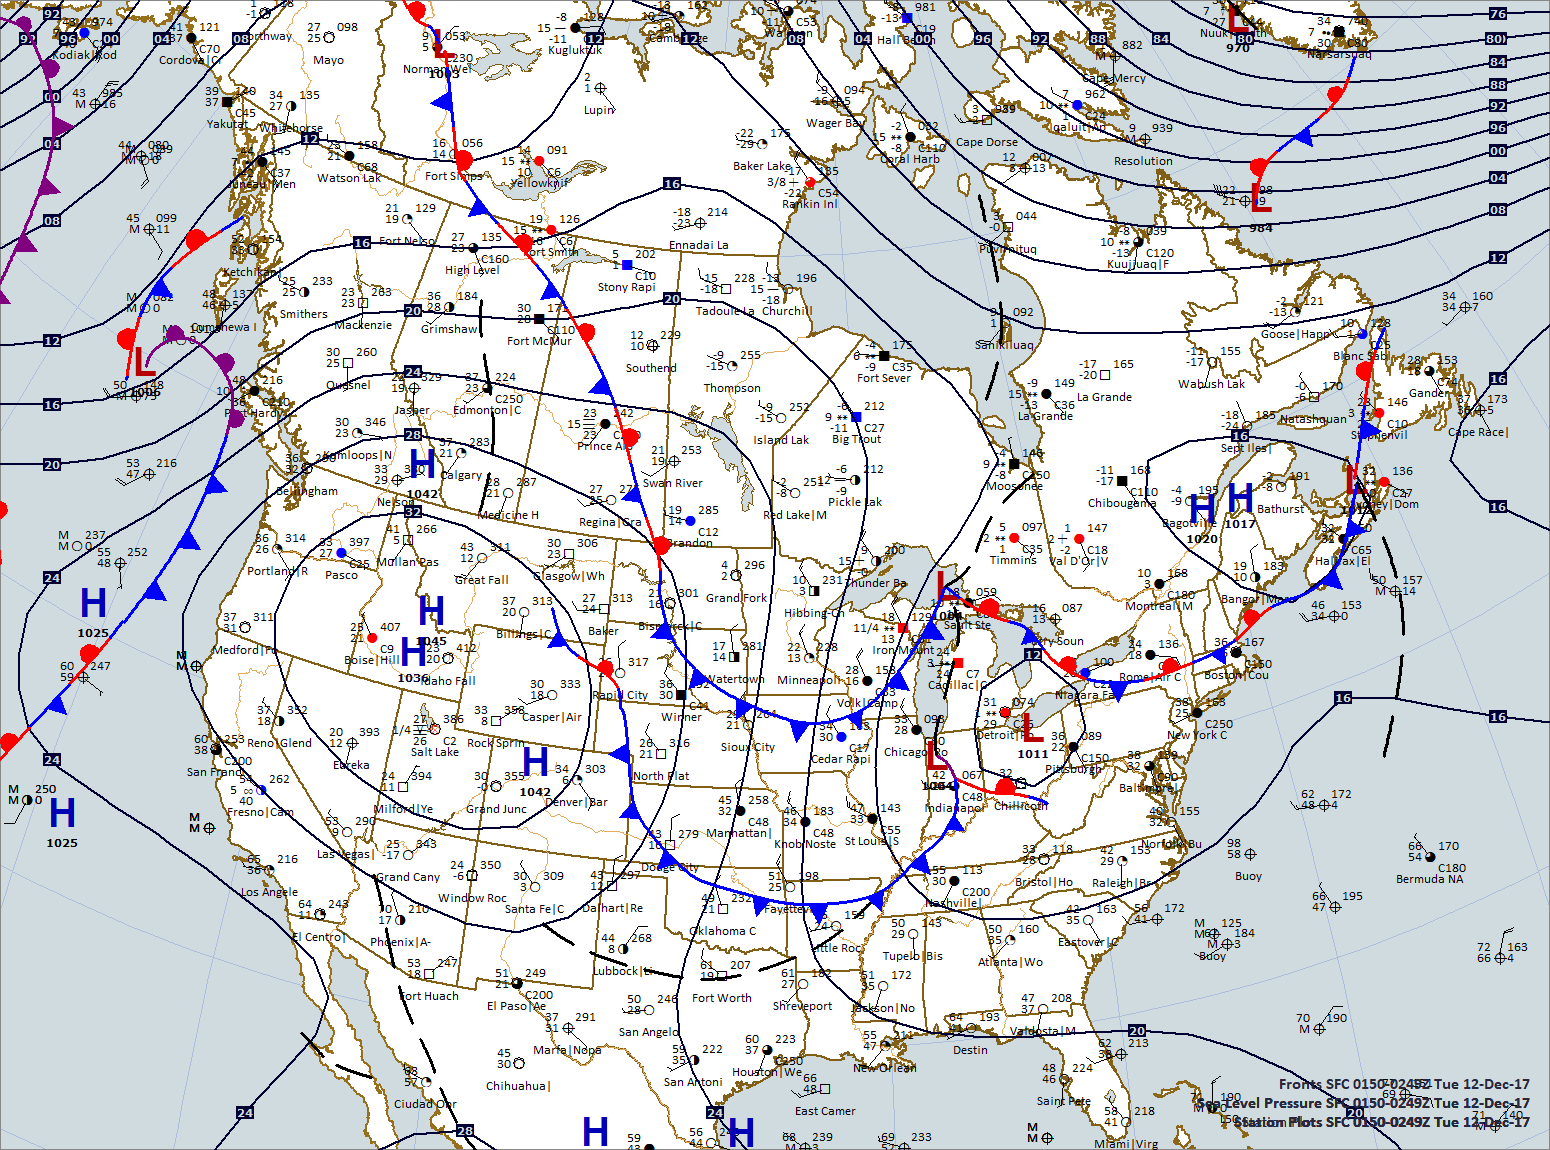
Evening US - Canada Surface Map

USA-Canada_SFC_Map_2300_CDT_3-11-2018-RESIZED.png

Map plotted by Digital Atmosphere software from WeatherGraphics. com

Pressure patterns determine the wind direction and speed. In this post we will look at how a large area of high pressure and areas of low pressure are controlling the wind patterns over the U.S. and Canada. The air converges into low pressure centers and diverges away from high pressure centers. Air flows counterclockwise around low pressure in the Northern Hemisphere and clockwise out of high pressure centers. 

Large surface high pressure centered over the Northern Plains into Canada and south to Texas this evening. Temperatures in Northern Canada remain below zero with readings in the 30s across much of southern Canada into the U.S. east of the Rockies. The steamline map below, which is a snapshot of the wind direction shows north and northwest winds from central Canada to New England and from the Northern Plains south to the Gulf of Mexico. Light and variable winds extend from the West Coast to the Intermountain region, northern Rockies into Canada. Easterly winds are reported from western Canada toward the Gulf of Alaska. Air is flowing  out of the high pressure westward and to the east and southeast. The Polar Front extends across the southern United States and Mexico and the Arctic Front stretches across northern Canada. Notice the northeast winds from the North Atlantic into eastern Canada. This flow is wrapping around a large low pressure center in the North Atlantic. Clouds and precipitation are found near the fronts, bodies of water, and in the central and eastern United States. 

STREAMLINES PLOTTED BY dIGITAL aTMOSPHERE SOFTWARE AVAILABLE AT wEATHERgRAPHICS.COM

STREAMLINES PLOTTED BY dIGITAL aTMOSPHERE SOFTWARE AVAILABLE AT wEATHERgRAPHICS.COM

Cirrus in Sedona

Taken near the Little Horse trail head south of the Village of Oak Creek, Arizona near Sedona; Photo by Craig Johnson

Taken near the Little Horse trail head south of the Village of Oak Creek, Arizona near Sedona; Photo by Craig Johnson

Cirrus clouds were flying high over northern Arizona recently on what was a beautiful February day. The cirrus were in advance of an upper level storm system crossing Arizona. These cirrus were very diffuse with a considerable amount of falling ice crystals. Surface temperatures were near 60 degrees. 

"Innocent"

Map was plotted using Digital Atmosphere software available from Weather Graphics at www.weathergraphics.com. 

Map was plotted using Digital Atmosphere software available from Weather Graphics at www.weathergraphics.com. 

It looks innocent but look out. Note the small low pressure center located between Cuba and Florida. It isn't much now but it is expected to become a large winter storm for the East Coast as it moves parallel to the coast this week. High winds, snow, ice and rain are expected. See your local forecast at weather.gov for details. 

If you will like to plot a map like this yourself you may purchase the software at www.weathergraphics.com. The graphic here does not do the software justice. It is versatile and plots surface and upper air data (and much more) readily available at no cost from the internet.

The surface data plot on this map uses the station model plot format that is available free on Weatherbriefing.com. 

-21 Degrees Fahrenheit

Cotton Region Shelter - Photo by Craig Johnson 01-01-2018

Cotton Region Shelter - Photo by Craig Johnson 01-01-2018

Data plotted by Digital Atmosphere - Software available at www.weathergraphics.com

Data plotted by Digital Atmosphere - Software available at www.weathergraphics.com

Arctic high pressure was centered near Omaha, Nebraska this morning sending temperatures below zero over much of the central United States. Cedar Falls, Iowa dropped to -19 F while the nearby Waterloo, Iowa airport fell to -21 F. Terrain and station location make a difference in overnight lows.

To say that Cedar Falls and Waterloo reached - 19 and -21 respectively is all a matter of where the temperatures were measured. The Cedar Falls temperature was measured in the shelter pictured above, which is in our yard at 922 feet above sea level. The airport is at 873 feet near the bottom of the drainage in the Cedar River Valley. Cold air draining into the river valley on a clear night will usually produce the coldest temperatures. Areas in higher elevations will typically not be as cold. Sometimes the difference will be more the 2 degrees.

So what was the low in Cedar Falls and Waterloo? Good question. As always, it depends on where the temperatures were measured, the surrounding terrain, and whether the measuring location has more urban than rural characteristics. The airport has a more rural setting while the Cedar Falls location is residential so the airport would be colder on a night like last night. On windy or cloudy nights the difference is less.

It's Cold Outside!

It's 4:30 on the afternoon of Saturday, December 30, 2017. The temperature is -6 degrees Fahrenheit. After yesterday's 3.4" snowfall in Cedar Falls, Iowa the stage is set for a very cold night of sub-zero readings. Overhead a patch of clouds is drifting to the southeast. The first photo shows altocumulus clouds in the southwestern sky. The second photo is looking south at altocumulus in the top portion of the photo with altostratus covering the bottom.

2017_12_30_0588_edited-web.jpg
2017_12_30_0591_edited-web.jpg

Sub-Zero Recipe

SFC_NC_12-29-2017_2000Z.png

Start with 24 hour nights, season with snow, and watch the temperature tumble. That's the recipe for bitterly cold weather. The nights are long in an Arctic winter. Above the Arctic Circle on the Winter Solstice the Sun does not rise. The farther north toward the North Pole the more days the Sun spends below the horizon. Add snow cover and there is no way what sunlight there is will warm the earth - at least not until the daylight lasts longer. 

In polar regions the very low sun angle of winter combined with snow on the ground causes most of the sunlight to be reflected back to space instead of being soaked up by the earth in the form of heat. At night the snow cover radiates heat to space - and temperature get colder. The only thing that changes this scenario is the advection (movement) of warmer air from the south (or from the north in the Antarctic) into polar regions. That is, in the Arctic southerly winds bring warmer air from the south to the north. That warms the temperature temporarily. In fact, bringing warmer air into the Arctic is part of the process of balancing global temperatures. The warmer air is cooled as it moves  north and mixes with colder air. 

The map above shows the next surge of Arctic air moving into the Upper Midwest. Night time temperatures over the weekend will be colder than 15 to 25 below zero in northern areas - and very cold further south as the cold air heads south. It will be modified as the air moves into areas in the southern Midwest, and points south, that are not as cold. By looking at the station model plots is it possible to see the wind directions at each reporting station. There is a huge area of northwest winds spreading out of Canada. 

High Flyers Lead the Way

Strong northwesterly winds aloft from the North Pacific combined with Arctic air masses near the surface are sweeping over much of the United States east of the Rockies. Weak storm systems riding the flow are heralded first by high flying cirrus clouds. "Warmer" air drawn over the cold arctic air mass is lifted and creating middle and low cloudiness.

Map plotted by Digital Atmosphere; Software available at www.weathergraphics. com

Map plotted by Digital Atmosphere; Software available at www.weathergraphics. com

At the surface low pressure is tracking east and southeast across the Upper Midwest. Ahead of the system light snow is falling. Behind the system the next surge of reinforcing cold air flies southeast behind another Arctic cold front. 

Map plotted by Digital Atmosphere; Software available at www.weathergraphics. com

Map plotted by Digital Atmosphere; Software available at www.weathergraphics. com

The high flying cirrus are the first sign of the next snowfall. 

Photo by Craig Johnson

Photo by Craig Johnson

As air drawn into the storm system is lifted over the colder air moisture condenses and snow begins to fall from nimbostratus. 

Photo by Craig Johnson

Photo by Craig Johnson

This pattern is gradually laying down snow cover across the Midwest. The snow cover is enhancing the cold air by reflecting sunlight back to space during the day and on clear nights, radiating heat to space. It all adds up to a cold pattern for the foreseeable future. 

Snow cover map courtesy of NOAA, 12-27-2017

Snow cover map courtesy of NOAA, 12-27-2017

Weather in Motion

As we know, weather moves! Our atmosphere is an ever moving cauldron of many processes acting at once. The purpose is to balance temperature differences, water the earth and sustain our  environment. Without weather life would not be possible on Earth.

Weather forecasting is the part of meteorology where the public gets to see the fruits of meteorologists labor on a daily basis. While there is much scientific research going on behind the scenes the weather forecast is where the rubber meets the road. If forecasts are dependable the science looks good. When forecasts are wrong it doesn't look so good. Fortunately the science has advanced to the point where forecasts are reasonably dependable even though there is considerable of room for improvement. 

Some of the tools used to create your daily weather forecast are forecast models. There are many models - many nations do their own modeling for their own purposes. The United States, Canada, the European Union, China, Japan, Russia and many others have their own models. 

None of the models are perfect. The models lack sufficient data and the ability to process the available data to make the models perfectly mimic the weather. None the less, the models are very useful.

One of the models is the American GFS (Global Forecast System). To give you an idea of what a model looks like here is a link to an animated version of the GFS. Link to it and just watch it move. It runs for a two week period and is updated several times a day. Keep in mind that this is just 1 of many forms of output available to forecasters. You are seeing a very tiny, but significant, part of what the model does. Occasionally this blog will show you some of our other tools. 

Click on the link below to see the GFS run. Pick the 1000_500_Thick to see an animation of the surface pressure systems forecast for the next two weeks. Don't worry about understanding everything you see. The point is to notice the movement that is forecast. You are watching one model's interpretation of what may happen. Forecasters pick and choose between the models based on their experience of watching models perform. There are other animations available. 

GFS Forecast Animation

If you want browse through other American models click the link below. 

U.S. Model Home Page

Weather Maps and Radiosondes

Map plotted by Digital Atmosphere which is available at www.weathergraphics.com. 

Map plotted by Digital Atmosphere which is available at www.weathergraphics.com. 

The surface map above shows weather observations shortly before 10:00 p.m. this evening. It is a little difficult to read the plots because of the small font. Look at Omaha, Nebraska. The plotted ceiling height is C31 which is code for 3100 feet above ground level. The sky is overcast. If you look at the station model plots and observation coding which are accessed on our home page you will see the Omaha sky is overcast. 

Now, look at the chart below. This is the radiosonde (weather balloon) plot from Omaha, Nebraska as of 6:00 p.m. local time. The red line is the temperature in degrees F while the green line is the dew point. wherever the lines are close together the relative humidity is high and the probability of cloud cover increases. On the far left the chart shows conditions are favorable for cloud formation - see the small gray boxes at the left side of the chart. You can see a small gray box on the left side marking the 3000+ altitude. This confirms a layer of low level moisture that is creating the overcast skies at Omaha. Notice that the layer is less than 2000 feet thick. Above it the  red and green lines diverge indicating a deep layer of dry air. There are several layers in which clouds are also possible - see if you can find them. These areas indicate the possibility of up to 3 layers of moisture that may be producing cloudiness. 

The Radiosonde plot is made by RAOB, a program available at RAOB.com.

The Radiosonde plot is made by RAOB, a program available at RAOB.com.

What does the instrument package look like? Learn more by clicking here.

Northeast vs the Southwest

US-Canada_0200Z_12-12-2017.png

Map plotted by Digital Atmosphere which is available at weathergraphics.com.

It's a tale of two weather regimes. The northeast is getting another taste of winter while parts of southern California are facing more fires.

A winter storm is organizing over the Great Lakes tonight and will spread moderate to heavy snow from the lower Great Lakes to New England during the next two days. Behind the storm lake effect snows are for areas western Lower Michigan and central Upper Michigan.

Then there is the west. Large high pressure centered over the Great Basin is creating strong winds in Southern California. The weather is favorable for continuing fires with the wind and single digit relative humidity. 

In between, gusty northerly winds along a cold front are bringing colder air to the Upper Midwest. The colder air is wrapping around the backside of the developing low over the Great Lakes.

Cirrus spissatus - a unique cloud.

Photo Copyright by Craig Johnson, 12-2-2017

Photo Copyright by Craig Johnson, 12-2-2017

Cirrus spissatus is a unique cloud type. It is the only cirrus cloud dense enough to hide the the disk of the Sun. Other cirrus allow the disk to be at least faintly visible. Most spissatus form by the breakdown of the anvil of a thunderstorm. Spissatus not formed by remnants of a thunderstorm anvil often appear as multiple patches of dense cirrus, often at different levels, like the cirrus in this photo. 

Variety's the very spice of life, that gives it all its flavor. - William Cowper

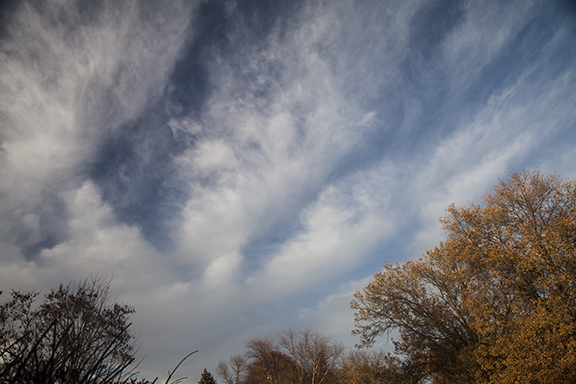
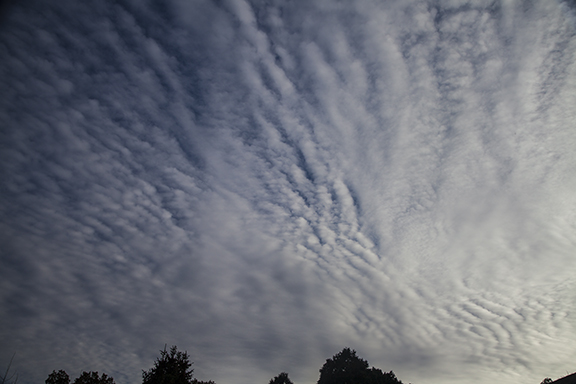
Variety in the sky raises many questions. Why are there multiple cloud types in the sky at the same time? What processes are causing these cloud types? Why do some of the clouds look like tufts of wool (floccus) while others are a hybrid of stratus and cumulus types. Why do some look like waves? (Hint: They are waves.) When looking at clouds - look closely. The shapes reveal the processes and air motions overhead. 

This morning we had three distinct different types of altocumulus in the sky. The first photo was taken looking to the southeast, the second was to the north, and the third was looking to the south. The photos were all taken within a few minutes of each other. Prairie skies are very interesting indeed!

Photo Copyright by Craig Johnson, 12-2-2017

Photo Copyright by Craig Johnson, 12-2-2017

The photo above is a good example of altocumulus floccus. The floccus form is concentrated in the right half of the photo.

Photo Copyright by Craig Johnson, 12-2-2017

Photo Copyright by Craig Johnson, 12-2-2017

The second photo is altocumulus stratiformis and altocumulus floccus. The floccus are identified by their puffy 'tufts of wool' look while the stratiformis are a flatter version of altocumulus. These types are mixed together in the photo above. It is easy to see that identifying cloud types is not always a clear-cut decision. Cloud processes and air motion are often part of a continuum rather than discreet structures. We often need to identify what are the dominate cloud types because cloud structures do not always fit into nice neat packages.

This tells us something about the complexity of our atmosphere. It is fluid with its motions transitioning in an infinite variety of ways. Many times we can look at clouds and see basic identifiable structures. However - don't stop there! Look closer and notice what is in the fine details. Try to imagine the type of flow that is creating the shapes you see. Sometimes the flow is what it seems to be. Other times the shapes are the result of secondary flow which requires more study. I will try to point out some of these differences in future posts. 

Photo Copyright by Craig Johnson, 12-2-2017

Photo Copyright by Craig Johnson, 12-2-2017

The third photo is altocumulus undulatus. There are several formations working together. The first are the clumps of cumulus that make up the overall structure. These clumps are arranged in bands caused by

Photo by Craig Johnson, 12-01-2017

Photo by Craig Johnson, 12-01-2017

The last photo is looking south. Note the unusual very thin altocumulus undulatus extending from the center to the right. These wavy clouds are subtle waves moving from right to left (west to east). These clouds were at a lower level than the more predominate clouds elsewhere in the photo.  Wave type clouds are typically caused by gravity waves.

From cirrostratus to altocumulus

2017_11_26_0337_edited-Web.jpg

The dominant cloud type in the sky often changes in a hurry in the middle latitudes. This photo was taken less than an hour after the cirrostratus photo posted yesterday. Instead of cirrostratus the sky was now dominated by altocumulus. The altocumulus here are wave clouds, caused by ripples in the flow. Flying through these clouds would provide a bumpy ride - much like a boat ride on a lake that is covered by waves. The waves are created by the wind friction as it contacts the water surface.

Cirrostratus

2017_11_26_0330_web.jpg

This is a photo of a classic cirrostratus sky. Taken at Cedar Falls, Iowa on 11-26-2017 at 3:15 p.m. CST,  it shows diffused sunlight and the classic "milky" sky of cirrostratus. The photo also reveals several CONTRAILS (condensation trails) left by passing aircraft. The hint of a halo is visible in an arc right of the Sun. Halos are caused by sunlight being refracted as it passes through ice crystals contained in the cirrostratus. The halo was only visible in the photo - not with the naked eye.