Clouds of the Day - Sunday, May 28, 2023

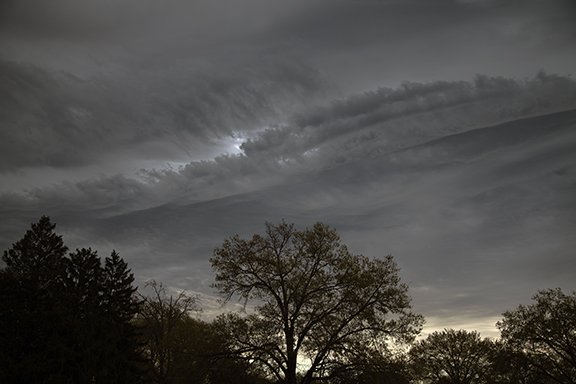
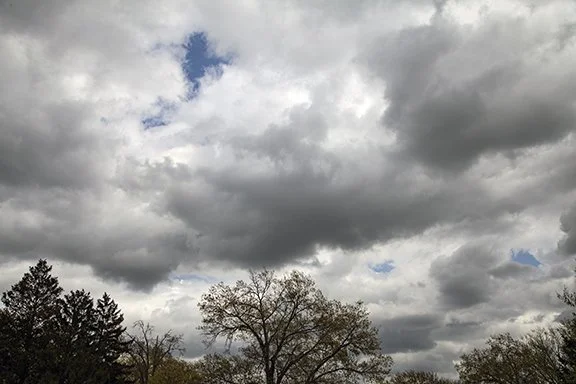
Finally, the clouds are back. After days of clear skies these striking mid-level clouds appeared around sunrise. This view looks east at a large sheet of Altocumulus stratiformis undulatus. Breaking the name down translates to high cumulus in a stratus sheet with undulations. The undulations, or waves, are caused by gravity waves which are ripples in the air flow similar to waves we see on water. The waves are in a layer that is stable, which means the waves will have limited vertical development that oscillate within the layer.

This photo is courtesy of NOAA/NESDIS. The cloud text was added by Weather Briefing, LC. Click the image to go to the NOAA/NESDIS webpage to learn more about Cloud Streets and Cloud Waves. The image shows the Mid-Atlantic coast of the U.S. on November 18, 2018. Click the Image to learn more.

Morning Weather Charts - May 26, 2023, 9:30 a.m. CDT

Today has dawned with a large cool high pressure still centered over the Great Lakes, showers on the High Plains, and in the Inter-mountain region. The maps and images below are valid only at 9:30 a.m. CDT, May 26, 2023. More commentary will be added today.

The GOES 16 USA visible satellite image at 8:21 a.m. CDT shows clouds over Maine, in the southeastern USA, over the High Plains, and northwestern USA.

GOES Visible Satellite Image is courtesy of NOAA/NESDIS/Star. IMages are valid at the indicated time and are used here for educational purposes only. Use the GOES Satellite Link on our homepage to view the latest image available from NOAA/NESDIS/STAR.

This surface weather map is plotted by Digital Atmosphere which is available at www.weathergraphics. com.

This radar image is used here for education (not operational) purposes. It valid only for the indicated time and date. It is not updated. Use the NWS radar link on our home page to see the latest image from NOAA/National Weather Service.

Ridges and Troughs - The Daily Weather Makers

The middle latitudes are home to a strong west to east flow around both the Northern and Southern Hemispheres. The map below shows the flow over most of North America this morning (5-25-2023). The winds aloft are shown by the green arrows.

As you can see the winds curve around troughs and ridges in the atmosphere. On the east sides of troughs is where precipitation is mostly likely to occur while the east side of ridges are mainly dry. That is highly simplified but for our purposes today it is mostly valid. The location of the troughs and ridges is illustrated with the up and down V symbols. NOTE: The Trof along the East Coast is mislabeled. The blue ridge marks should be flipped to point down like the Trof in the west.

Upper Air Flow at 500 millibars (approximately 18,000 feet) on May 25, 2023. The 500 millibar map used on this chart was plotted using Digital Atmosphere which is available at www.weathergraphics.com.

GOES 16 Visible Satellite Image courtesy of NOAA/NESDIS/STAR. Text added by Weather Briefing LC. 5-25-2023, 15:01 CDT

5-25-2023

Here is the USA Surface Map Plot this afternoon at 1600 CDT. Compare the satellite and radar images above with this map.

Surface high pressure over the Great Lakes with its clockwise rotation has spread much cooler air from eastern Canada across the Great Lakes and New England westward across the lower Great Lakes and the Ohio Valley to the Upper Midwest. The southern edge of the cooler air extends from the Carolinas to Tennessee and then northwest up through eastern Kansas, Nebraska, to the eastern Dakotas into Canada. Temperatures are in the 70s over Iowa but in the 80s in eastern Nebraska and the eastern Dakotas. Brandon, Manitoba reports 86 degrees on this map. The clouds, showers, and thunderstorms from Nebraska to Oklahoma are near and west of the boundary in eastern Nebraska southward. Dew points are in the 50s west of that boundary and in the 30s and 40s to the east. The air pressure here (northeast Iowa) peaked this morning and has been falling today as the high pressure begins to inch eastward away from Iowa. Our dew point is 32 degrees while Omaha, Nebraska’s dew point is 57 degrees.

The cumulus cloud fields on the satellite image are mainly along and west of the boundary that extends from southern Canada south through the eastern Dakotas, eastern Nebraska and Kansas and then to the East Coast through Tennessee and the Carolinas. The satellite image and radar show the showers and thunderstorms that are near and west of that boundary in the unstable air mass. We are stable here with sinking air motion overhead due to the high pressure ridge aloft and the high pressure centered at the surface over the Great Lakes.

This discussion is meant to show the interrelationships between weather systems that are affecting the eastern and central United States. Wind, temperature, dew points, air pressure, relative humidity, and precipitation are all determined by the location and movement of very large global and smaller regional weather systems - but they are all tied together.

This is our sky today in northeastern iowa - A clear sky under the ridge of high pressure aloft over the Great Plains and a surface high pressure centered over the Great Lakes.

Scrolling down to the next map we see where precipitation is expect to occur sometime during the next 7 days. Notice that the primary areas of precipitation are east of the troughs (west of ridges) shown on the map above. The primary dry areas are east of ridges (west of troughs). Why? Areas east of troughs (west of ridges) are where rising motion is often found. Rising air cools and expands as it rises and the cooling may cause the air to become saturated with moisture which leads to precipitation.

NOTICE: The forecast on the chart below is only valid on Thursday, May 25, 2023. The discussion in this post is using data and forecasts that are updated daily. It is used here to illustrate the explanation about how the position of troughs and ridges influences the daily weather.

Because the overall pattern is not expect to change much during the next week most of the precipitation will be found in the favored areas east of the troughs, which will not move much during the next week. The third chart below shows the expected amounts of precipitation for the next 7 days. Notice how the most precipitation is placed in the favored areas east of the troughs. Since the pattern is not expected to move much the heaviest rain is expected east of the troughs where little movement will concentrate the rain totals. You will notice that precipitation is expected in a few areas that are not within the favored regions. The explanation for that is beyond the scope of this post.

When the weather does not change much over long periods it usually means the overall pattern is not changing much. It stays wet where it is already wet and dry where it is already dry. When droughts occur the same thing happens, only for a longer time than a week. These types of events are a normal occurrence that is caused by a stalled weather pattern that will eventually change.

NOTICE: The forecast on the chart below is only valid on Thursday, May 25, 2023. It is updated daily.
The discussion in this post is using data and forecasts that are routinely updated. The forecasts will be out of date after 5-25-2023.

Clouds of the Day - Practice Makes Perfect

When learning how to identify clouds, practice makes perfect! It is through regular practice that we learn. Cloud identification can be a little frustrating because clouds do not always fit into nice neat categories. Not only to we need to estimate the cloud height (low, middle, high, or vertical through more than one layer) but we also need to identify the cloud shape. Doing those two things correctly leads us to one of ten correct principle cloud type names.

The first three images below all belong to one principle cloud type - cumulus. They are all heap type clouds - puffy clouds - which are a principle cloud type. You may stop right there because the principle cloud type would be a valid name for each of these clouds. Clouds may be further identified by adding their second (species) or third (variety) names. See the cloud supplemental section of the website for more information.

Cumulus humilus is a humble cumulus cloud. Photo copyright 2023 by Craig Johnson. 5-19-2023

Altocumulus because the cloud bases are in the middle level. Photo copyright 2023 by Craig Johnson. 5-25-2023

Altocumulus because the cloud bases are higher than 6,500 feet (middle cloud type). Photo copyright 2023 by Craig Johnson. 5-25-2023

Cumulus fractus and the bases of altocumulus. photo copyright 2023 by Craig Johnson. 5-25-2023

Automatic Weather Stations

I thought I would take some time to explain the data that our automatic weather station provides. The station samples conditions once per second all day and all night and is saved in a data base. The data is displayed online every 10 minutes. Be sure to read the Weather Station section on this website to learn more.

The basic observation looks like the first graphic below. The graphic is a snapshot of the weather at 10:20 a.m. this morning. To see the current 10 minute observation just click on the first observation graphic below.

Click this graphic to see the current observation.

The next graphic is the forecast for Cedar Falls, Iowa as of May 24, 2023. The data for the graphic is provided by the National Weather Service Office at Des Moines, Iowa.The red line is the temperature. Blue bars (there are none today (5-24-2023) display the probability of precipitation.

The temperature (red line), relative humidity (blue dashes), and dew point (green dots) are displayed on the next graphic. When temperature or the dew point change the relative humidity changes. When temperature increases/decreases the relative humidity decreases/increases and when the dew point increases/decreases the relativity humidity increases/decreases. Temperature and dew point may increase/decrease together or move opposite to one another.

Next up is barometric pressure, which is the pressure the air exerts. It varies as weather systems move through our area. Low pressure systems lower our air pressure and high pressure systems increase the air pressure. As different systems approach or leave our area the pressure will change.

Wind speed and direction are displayed in the next two graphics. Wind speed is on a typical graph with time on the lower axis and the speed on the left axis. The direction chart displays the time on the bottom axis and the direction (in degrees) on the left axis. North is zero and 360 degrees (bottom and top of graph). So north may appear on the top or bottom horizontal axis.

The rain graph displays the current rain total and the rain rate in inches to .01 inches of rain. The rain rate is in inches per hour.

Solar radiation units are displayed in watts per square meter. The graphs are smooth on days with constant solar radiation. That will occur on clear days or when the sky is overcast with a uniform cloud layer. Partly cloudy days show widely varying amounts of solar radiation as clouds cover and uncover the Sun.

The soil temperature is in degrees F and shows the variations from day to night and from wet to dry soils.

Clouds and Smoke - Thursday, May 18, 2023

Smoke continues to spread over the Upper Midwest. There are two areas of smoke. Considerable smoke aloft producing a milky sky resides over parts of Missouri northeast through eastern Iowa over Wisconsin and the Upper Great Lakes region. This smoke is entirely aloft.

The second area covers the Dakotas, parts of Montana and south into Wyoming and Nebraska and northwest Iowa, behind a cold front. Smoke is reported at ground level in much of that area.

Just east of a cold front that has entered northwest Iowa there is a wedge of clear air from northeast Kansas into southwestern through northeast Iowa to north central Wisconsin. This is based on satellite and surface observations. The satellite image below clearly shows the smoke behind that front and a second cold front to the north. It also shows a field of cumulus clouds.

The fronts are shown on the surface maps below. The first map shows the surface observations with the fronts superimposed and the second points out a few of the surface observations where haze and smoke are reported. The haze is the result of the smoke that has reached ground level.

This image is courtesy of NOAA/NESDIS/STAR. The notations are added by Weather briefing.

Clouds in the Cumulus cloud field entering northeast Iowa this afternoon.

If you would like to learn how to read and decode the station model plots use our tutorial by scrolling down our HOMEPAGE HERE to the tutorial about station model plots. In the meantime, the second map points out a few of the surface observation plots which report haze, smoke, and reduced visibility due to smoke at ground level.

Map plotted by Digital Atmosphere available from www.weathergraphics .com.

Map plotted by Digital Atmosphere available from www.weathergraphics.com. Notations added by Weather Briefing, LC.

Clouds of the Day -Wednesday, May 17, 2023 - Smoke Aloft from Alberta Fires

Fires burning in Alberta, Canada has spread smoke over Upper Midwestern skies during the past two days. Here is our sky this morning over Cedar Falls, Iowa. The view is looking SSE with the Sun out of the photo to the left. The milky sky is caused by the smoke aloft. Sunlight is scattered by the smoke particles which leaves pall over the sky.

To get a broader perspective scroll down to look at the GOES 16 satellite image this morning at 8:21 CDT. Aircraft CONTRAILS are visible as thin straight lines in the northwest edge of the smoke. CONTRAILS are short for Condensation Trails. The particles serve as condensation nuclei for water/ice to condense on. The smoke has spread as far south as northeastern Missouri and as far west as Nebraska, and the Dakotas.

The bottom image from yesterday’s post looks the same direction as the smoke image below from today. Notice the difference in the sky color today than it was yesterday.

Smoke covers the sky - May 17, 2023

This Image is courtesy of NOAA/NESDIS/STAR Goes East

This Image is courtesy of NOAA/NESDIS/STAR Goes East

Clouds of the Day - Tuesday, May 16, 2023 - Meet the Delicate Cirrus!

Click HERE for the answers.

Cirrus create beautiful patterns in the sky. From wispy filaments to broad milky sheets, the ice crystals in Cirrus are shaped by high altitude winds blowing above 16,500 feet. The examples below are true to their name - Cirrus. It means wispy or hair-like.

Stare at these Cirrus. The longer you look the more details you see. There are at least five CONTRAILS (Condensation Trails) from passing aircraft in the photo above. You might find more.

More hair-like clouds and CONTRAILS in the photo above. Cirrocumulus are also visible.

Cirrus are precipitating clouds. Streamers of ice crystals fall easily in the cold air where Cirrus reside. Check out the clouds above.

The clouds below do not show off streamers of ice crystals but impressed on the flow are waves made visible by the Cirrus. Without the clouds we would not know there are waves overhead. Are you able to find the waves? They are called Gravity Waves.

Way in the distance are ice crystal streamers falling from a patch of Cirrus floccus. Floccus is what we think of when we see clumps of wool. The clumps of called flocks of wool. Each strand of wool has a natural curve. Those curves produce the clumps of wool we call flocks. Cirrus sometimes remind us of flocks of wool as we see in the photo below. There are other examples on this blog of more pronounced flocks of wool.

Clouds of the Day - Wednesday, May 10, 2023

The low Sun angle after sunrise causes sunlight to be diffused by the cirrostratus as shown in the top photo. This photo is looking east.

Cirrostratus after sunrise

The next two photos were taken after mid-morning. The left photo is looking NNW and shows very thin Cirrus and Cirrostratus. The right photo looks to the south. This area of Cirrus and Cirrostratus is thicker than the what we see in the left photo.

Cirrostratus and Cirrus at mid-morning

Cirrus and Cirrostratis

Clouds of the Day - Tuesday, May 9, 2023

Stratus is a layer cloud with smooth bases and tops. Stratus may cover the entire sky or form in patches but their horizontal dimensions are always much larger than their vertical dimensions.

Yesterday I took a few photos of stratus that covered much of the sky in the early morning, but cracks were beginning to form. This indicated that the layer was beginning to break up because drier air was evaporating the cloud. Drying may be caused by sinking motion from above or it can occur by mixing of drier air from below.

In the photos above the left photo is shot at the widest angle and the photo on the right is a close-up of the lower left corner of the left photo. Eventually most of the stratus evaporated. Cumulus formed as surface temperatures warmed and created updrafts. The stratus changed to cumulus because of changes in the motion of the air from sinking to rising.

Clouds of the Day - Growing Cumulus - Monday, May 8, 2023

Bright sunshine, warmer temperatures, and a moist air mass are adding up to developing cumulus clouds today. Cumulus start small and grow as large as the atmosphere allows. Northwestern Iowa may experience a few thunderstorms this afternoon but here in the northeast the atmosphere will likely not support thunderstorms. We expecting a pleasant warm partly sunny afternoon!

Clouds of the Day - Sunday May 7, 2023 - From Fog to Thunderstorms

Thunderstorms often fill the sky with bizarre cloud formations. Here are a few examples from this afternoon as an area of thunderstorms passed through our region. None of these clouds were dangerous. We had .02 inches of rain, brief wind gusts, and a front row seat to clouds in action.

Copyright 2023 Craig Johnson

Copyright 2023 Craig Johnson

Copyright 2023 Craig Johnson

Copyright 2023 Craig Johnson

Copyright 2023 Craig Johnson

Copyright 2023 Craig Johnson

Thunderstorms produce downdrafts of cooler air that fall to the ground and spread across the countryside. This view of the National Weather Service Radar at Des Moines, Iowa shows three areas under severe thunderstorm warnings. Cedar Falls, Iowa is located near Waterloo and as you can see the heavy action was mostly south of us although we did get a little rain from the north side of the storms as they side swiped us to the south. Just southwest of Des Moines is a thin line showing on radar. It is a temperature change line where cooler air is moving southwestward out of the thunderstorms located to the east-northeast. The leading edge is called an outflow boundary. When an outflow boundary passes you will feel gusty winds and cooler temperatures.

The radar image above is from radarscope software at https://www.dtn.com/radarscope-4-0/

Clouds of the Day - Fog (Stratus) - Sunday, May 7, 2023

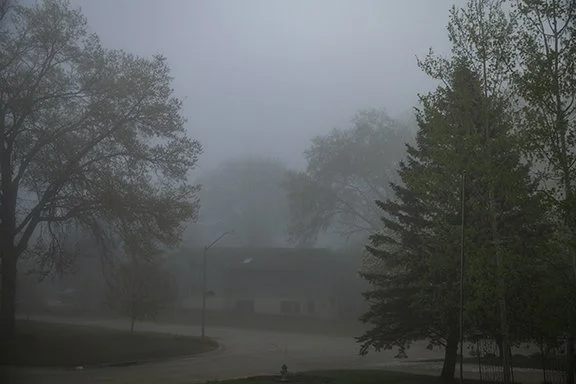
We did not have a pretty sunrise this morning. Instead, we were greeted by dense fog. The fog formed in areas that received significant rain during the past 30 hours. We had .53 inches so the ground and grass were wet overnight. Evaporation of the water increased the relative humidity to near 100% and the result was fog. The two photos below illustrate the situation. It is easy to see how objects in the distance disappeared in short order. Visibility was reduced to about 750 feet.

A foggy Morning

Trees less than a block away disappeared into the fog

That brings us to what is sometimes a confusing relationship.

Temperature, dew point, and relative humidity are related. Changing the temperature while holding the dew point steady causes the relative humidity to change. Holding the dew point steady and changing the temperature also changes the relative humidity. If we raise the temperature and raise the dew point the relative humidity may be held steady - or maybe not. It depends on how much we change the temperature and dew point. There are other combinations that we won’t go into right now.

Using the chart below, which traces the changes in temperature, dew point, and relative humidity today, as measured by our weather station, we can see that at 7:20 a.m. the temperature was 58.6 degrees, the dew point was 58.3 degrees, which made the relative humidity 99%. No wonder we had dense fog!

If we follow the red temperature line we can see that the temperature and dew point (green dashed) lines converged overnight. We also can see the the lines diverged this morning after 10:00 a.m. The relative humidity increased overnight. This morning the relative humidity line (blue dashed) decreased rapidly. As the temperature warmed and the dew point held steady, the air could “hold’ more water vapor, so the relative humidity was no longer near 100%. If we looked at the wind speed we would see that winds were increasing at the same time which mixed drier air in with the very damp air near the ground which lowered the dew point and relative humidity.

Weather stations like the one we have are able to illustrate how temperature, dew point, and relative humidity change in relation to each other. If you know how to interpret the changes you are able to explain what is happening in the atmosphere and why. Click here to see our current weather observation which we update every 10 minutes.

Pressure Jumps

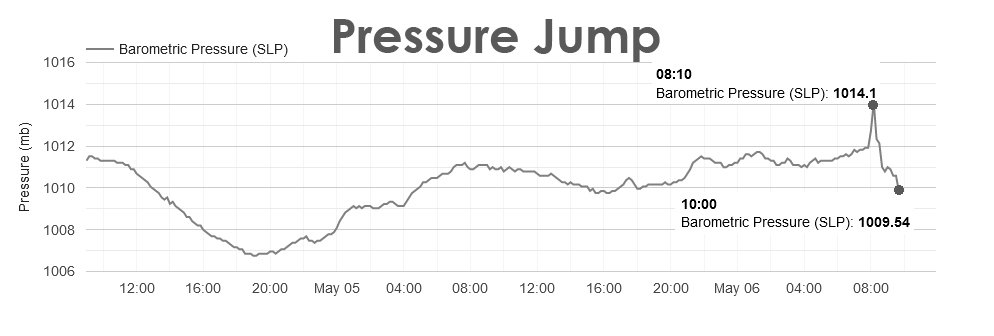
Pressure jumps are sudden changes in air pressure and are easily seen on a meteograph like the one below. A meteograph is simply a graph of meteorological measurements - such as temperature, dew point, wind speed and direction, or as in this case, air pressure. The air pressure jumped 2 millibars during the 10 minute interval from 8:00 a.m. to 8:10 a.m. shown on this chart. The jump was caused by thunderstorms that moved through the area. The leading edge of the storms included a downdraft of cooler air. It can be felt as a short period of gusty winds that precedes most thunderstorms. Immediately after the leading edge of gusty winds passed the pressure dropped back near where it started. This shows up as the sharp spike in pressure followed by a sharp drop.

The pressure change had two components. There is the overall pressure change caused by the large weather systems affecting the area and also any small disturbances, in this case the thunderstorms. Prior to the spike the pressure was gradually rising. After the spike the pressure dropped just as fast and then began a stronger fall as the thunderstorms moved away. The continued drop in pressure was due to a change in air mass that followed the thunderstorms. The boundary between the original air mass and the new one was a major reason the thunderstorms occurred in the first place.

This is a good example of how an air pressure graph can reveal the changes in air masses and other events that cause long term and short term changes in our weather. By 10:00 a.m. the air pressure was down to 1009.54 millibars which was lower than it was before the storms.

A barograph is an instrument that records pressure changes on a chart.

Directional Wind Shear - Seen and Unseen

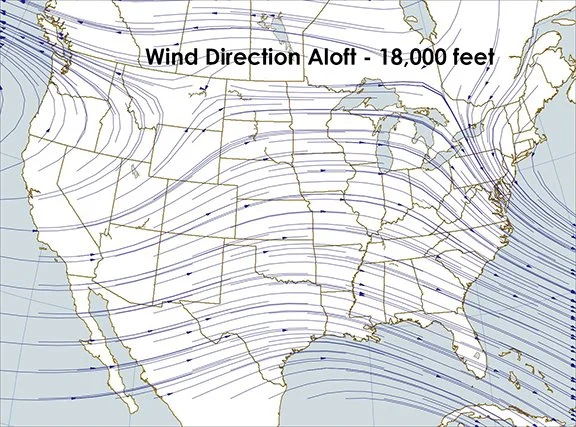
The two maps below show the wind direction at the surface and at approximately 18,000 feet during the evening of May 5, 2023. The plots are from data provided by radiosonde balloons launched at 0000Z.

Pick the direction of the surface wind where you live and compare it to the wind direction at 18,000 feet. The difference is called the directional wind shear. Notice the difference in the wind direction from the surface to 18,000 feet. For example, at our location in Cedar Falls, Iowa (northeast Iowa), our surface wind was from the southeast. But at 18,000 feet it was from the west.

Why does this matter? One example to mention is knowing the direction shear through the vertical layers of the atmosphere helps forecasters determine the threat of severe weather. It helps to know directional shear, which plays a role in determining what kind of severe weather may occur - such as, whether there would be damaging winds, hail, or tornadoes, or a combination. It also helps in determining where turbulence will occur, which is important information for aviation. I will discuss more on that in another post.

Shear data is available for many layers in the atmosphere. Directional wind sheer is unseen in clear air. When clouds are present directional wind shear may be visible. I am only showing the difference in wind direction between two layers in this example. Many other possibilities exist. Related to this wind direction shear is wind speed shear, also a subject for another post. It is also a type of shear that may be visible when clouds are present. I will use cloud photographs to show you how to locate examples of directional and wind speed shear.

Map plotted by digital Atmosphere software available at www.weathergraphics.com

Clouds of the Day - Friday, May 5, 2023 - Clouds Go Vertical

After clear skies most of this week, a change is on the way. With the weather pattern over the United States shifting slowly eastward, storminess in the western United States is now inching into the middle of the nation. This means rain, thunderstorms, and the potential for severe weather. To keep up with what is happening with any severe weather use this link to the Storm Prediction Center.

For the general forecast from the National Weather Service click this link to the Weather Prediction Center.

For your local forecast from NOAA click to the National Weather Service homepage and then click on your state and go local from there.

The photos below were taken this afternoon. They revealed a return of warmer weather clouds - cumulus, and cumulus congestus.

Cumulus mediocris Photo copyright 2023 by Craig Johnson/Weather briefing LC

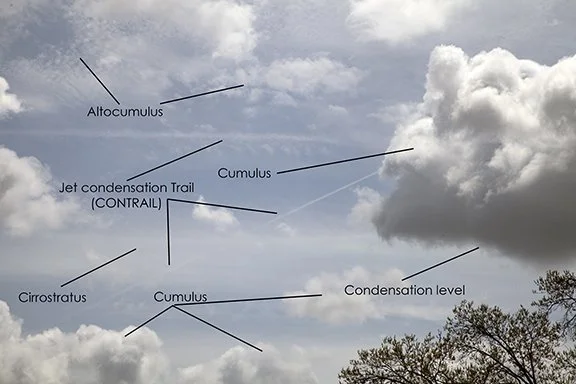
The cloud bases in both photos show the condensation level when low level air rises into the mid-levels of the atmosphere. The distinct bases of these cumulus show where the rising air cools enough to cause condensation of water vapor into tiny cloud droplets. The dry air below the clouds creates good visibility because the air is clear of condensation and haze.

Cumulus Congestus Photo copyright 2023 by Craig Johnson/Weather briefing LC

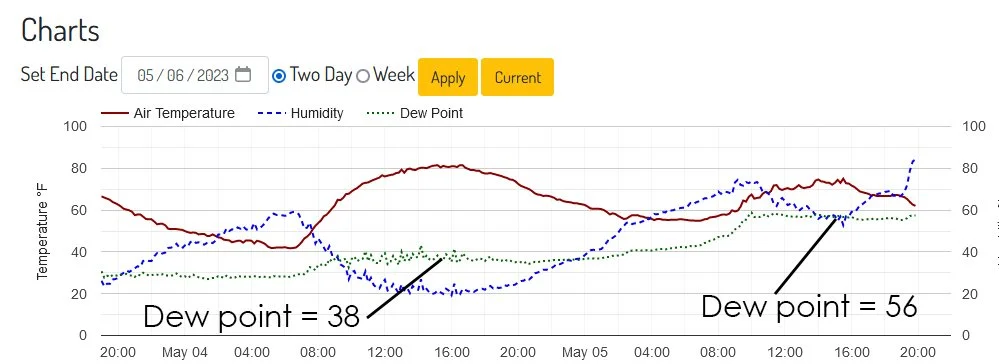
Looking at the weather station graph showing the dew point trace of the past 48 hours (5-5-2023), indicates dew points had risen from the upper 30s yesterday afternoon (5-4-2023) to the mid 50s today. The increase in moisture shows up in the cloud cover today. Rising motion plus moisture created the cumulus clouds. The cloud bases were at about 4,800 feet.

Weather Station traces for temperature, dew point temperature, and relative humidity

Weather Prediction Center (NOAA) Forecast map for 5-5-2023 - 5-6-2023

After several days of strong northerly today began a southerly flow that increase the moisture content of the air. The dotted green line on the chart above is the dew point trace. It shows the rise in dew points overnight into today. Light rain began falling early this evening.

Clouds of the Day - Wednesday, May 3, 2023

Today started with spectacularly clear skies and ended with an even more spectacular sunset. This was the first time all week that clouds appeared in our sky. What a view it was this evening. Check out the clouds and the colorful yellow sunset. The yellow tint to the sky was courtesy of very dry air - 25% relative humidity - and dust particles that screened out all but the yellow hues as the Sun approached the horizon for sunset.

Note the various cloud types that formed overhead this evening. The cloud streaks were bands of Altostratus and Altocumulus clouds. There were also pillow-like Altocumulus and wave type clouds caused by gravity waves rippling through the air overhead.

Photo copyright May 3, 2023 by Craig johnson

Photo copyright May 3, 2023 by Craig johnson

The clouds above were visible directly overhead. We are looking at fall streaks (also called virga) which were ice crystals condensing in the cold air aloft and descending into the drier air below where they sublimated. Sublimation is the term for ice crystals changing from crystals directly to invisible water vapor. Now you see it and now you don’t.

Photo copyright May 3, 2023 by Craig johnson

The sunset was vivid this evening. The yellow glowed brightly in the west.

Photo copyright May 3, 2023 by Craig johnson

When watching clouds practice looking for detail in the cloud formations. The above photo is labelled to help you notice some common patterns we see throughout the year.

Photo copyright May 3, 2023 by Craig johnson

One final look at sunset this evening. Views on the prairie can be spectacular because the wide open spaces allow for maximum visibility in the fresh air outdoors.

The yellow sunset indicated dry air to the west over the Great Plains but it was dry here too. The dew point trace on our weather station shows the relative humidity (blue line and right-hand scale) dropping to 19% around 4:00 p.m. CDT. Notice the relationship between the relative humidity and the temperature (red line). As the temperature rises and the dew point changes little, the dew point drops. It reaches it’s low point during the day when the temperature reaches its maximum. Then as the temperature cooled in the late afternoon and evening the relative humidity began to rise.