Clouds of the Day - July 2, 2022

Today the sky featured cumulus clouds. Cumulus are puffy or heaped clouds than can be found at all levels of the atmosphere. In the low levels they are cumulus. In the middle levels they are altocumulus. In the high levels they are cirrocumulus. The first photo below shows mid-level altocumulus above low level cumulus.

The next photo shows a close-up of the base of a cumulus cloud. It formed in the low levels below 6,500 feet.

The last photo shows cumulus humilus - humble cumulus. They are also sometimes called fair weather cumulus.

Clouds of the Day - July 4, 2022

Here are cumulus at two levels - low level cumulus mediocris (mediocre cumulus) and altocumulus and cumulus castellanus (cumulus that look like castle turrets.

Here we see altocumulus and a few patches of smooth layered altostratus. The altocumulus are ragged looking, much like tufts of wool - altocumulus floccus.

Below is a better look at the ‘tufts of wool’ which are altocumulus floccus.

Finally here are the ‘tufts of wool’ much closer.

Clouds of the Day - June 30, 2022 - Mid-Level Cumulus and Stratus

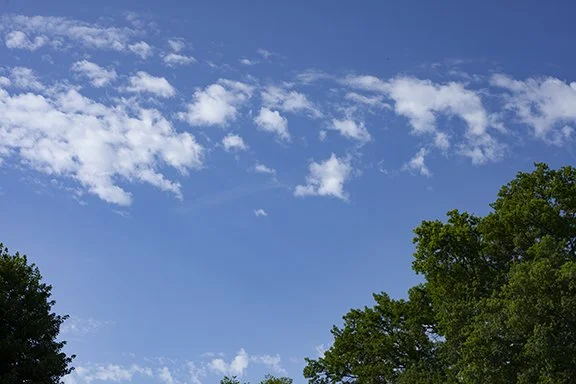
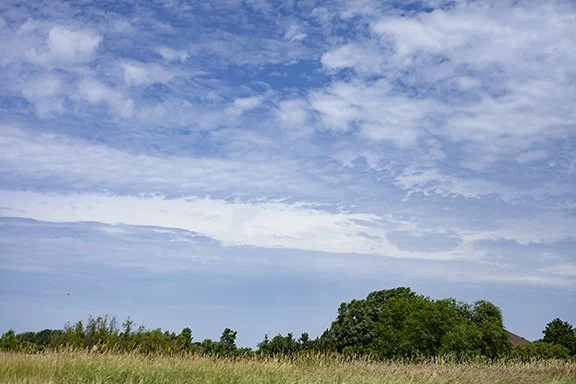
I am posting five photos today. The first two were taken at Noon, looking northwest from Cedar Falls, Iowa. The last three were taken in the mid-afternoon. The first two photos show two principle cloud types; cumulus and stratus.

The clouds are in the middle level of the atmosphere (between 6,500 ft and 20,000 ft). The principal cloud types in the mid-levels use the prefix ‘alto’ so they are altocumulus or altostratus. The prefix alto means ‘high’ so these clouds are high cumulus and high stratus when compared to lower cumulus and stratus found below 6,500 ft.

Some of the cumulus are separated by small areas of blue sky. Others are in a thin layer that includes waves or ripples. Near the top of the photo the cumulus are larger and are individual cells rather than part of a continuous layer. Near the bottom of the photo the clouds are stratus; a smooth layer without ripples.

What can we conclude from this photo?The air is more unstable (deeper upward and downward motion) in the upper half of the photo. It is more stable in a shallow layer that is smooth in the bottom half of the photo. The upward motion is stronger where the clouds are larger lumps with blue sky in between. The flat layered clouds form in a broader area of gentler upward motion.

The last three photos show different views of altocumulus clouds. The cloud cells look much small than the altocumulus in the first and second photos because they are much higher. The size of cloud elements help us estimate cloud height (low, middle, or high) but it can sometimes be tricky. Estimating height comes with experience with cloud size and the location of other clouds helping to make the estimate.


Photo by Craig Johnson, Weather Briefing, LC. 12:00 p.m. CDT looking northwest of Cedar Falls, Iowa. Cloud description in the text of this post.

Photo by Craig Johnson, Weather Briefing, LC. Close-up of photo above taken at 12:00 p.m. CDT. Clouds in this photo are primarily altocumulus with altostratus variety in the lower 20% of photo.

Altocumulus Photo Looking NE from Cedar Falls, Iowa by Craig Johnson, Weather Briefing, LC

Altocumulus photo looking ENE from Cedar Falls, IA by Craig Johnson, Weather Briefing, LC

Altocumulus and Altostratus Photo looking southeast from Cedar Falls, IA by Craig Johnson, Weather Briefing, LC

Here is the surface map as of 18Z (1:00 pm CDT). Low pressure in Utah and Wyoming will be moving eastward today and tonight. The clouds in the above photos are forming ahead of that front in a southwesterly surface flow. Automated weather stations at Waterloo, Iowa and other locations are not indicating clouds because automated stations do not measure cloud ceilings above 12,000 feet. Locations such as Mason City, Fort Dodge, and Sioux City in Iowa are plotting clear skies. Des Moines, Iowa and Omaha, Nebraska plot ceilings of 25,000 feet (C250). Those ceilings are estimated by human observers. The photos above show clouds in the Waterloo/Cedar Falls area.

As the low pressure tracks eastward moisture, warmer temperatures, and lift are expected to increase over the region with thunderstorms expected to develop later today, tonight and into Friday. Check your local forecast to see what is expected if you live in this area of the central United States west to the Rockies. On our home page click on the National Weather Service for your forecast.

Map plotted by Digital Atmosphere. The software is available at www.weathergraphics.com.

Clouds of the Day - June 29, 2022 - Cb can run but cannot hide

Photo by Craig Johnson, Weather Briefing, L.C.

Through the tangle of wires and lamp posts is a Cb - a thunderstorm. Cb is the weather abbreviation for cumulonimbus - the thunderstorm. This is the only type of cloud that produces thunder, lightning, and hail. Tornadoes are associated with cumulonimbus although funnel clouds and weak tornadoes can be seen below tall cumulus with strong updrafts before lightning is seen and thunder is heard. It is the mighty Cb that brings severe weather and heavy rain.

But not all Cb clouds bring hail, damaging winds, and tornadoes. In the entire family of Cb clouds are a variety of personalities. Most storms are beneficial, providing much needed rain and cooling winds. Look for these clouds in the distance, or as in this case, only 20 miles away. When they are overhead the sky looks ominous, the wind picks up, and the the rain begins as the lightning flashes and the thunder roars. Be on alert for rapidly changing rough weather and get indoors away from lightning and the threatening weather.

Clouds of the Day - June 27, 2022 - Two Cloud Layers

Photo by Craig Johnson, Weather Briefing, L.C.

Billowing cumulus and a layer of altocumulus share the sky in this photo. The cumulus have their base below 6,500 ft but are building up toward the higher mid-level altocumulus clouds. The cumulus are forming because rising air in the low level of the atmosphere has reached its the level of free convection where the air is free to rise unhindered. As long as the temperature of the rising air is warmer than the surrounding clear air it will continue to rise, even through the altocumulus layer.

The altocumulus have formed in a layer of moist air where gentle rising motion is occuring. The layer is cooling as it rises which has caused clouds to condense. The depth of the layer is shallow so the vertical development of the puffy clouds is shallow - not as tall as the larger lower cumulus.

When water vapor condenses from an invisible gas to visible water droplets or ice crystals, heat is released. The result - as clouds form heat is released into the atmosphere. The heat was originally stored as latent heat in the water vapor. The heat used to evaporate the water becomes the latent heat. It is called latent because as the water vapor moves with the wind the heat goes with it. That heat is not sensed, but it it there and released in a different place when condensation occurs. This process is an important part of the water cycle and it allows vast amount of heat to be moved around the world on the wind without causing a rise in temperature. The temperature only rises when the heat is released by condensation into a cloud and precipitation. This thermostat is an indispensable part of the Earth’s heat budget.

Clouds of the Day - June 26, 2022 - What a View!

Photo by Craig Johnson, Weather Briefing, L.C.

Above: Sometimes the weather just cannot help itself! This thunderstorm was located east of Interstate 35 and was visible from the Iowa Rest Area south of Story City. The above photo shows most of the storm, minus a rainbow that was visible on the north side (left) of the storm but not shown in this photo. Notice the nearly full Moon located above and right of the main storm updrafts near the top of the photo. The photo was taken in the early evening.

Photo by Craig Johnson, Weather Briefing, L.C.

Above: This view is a closeup of the south side of the storm from the back. I was looking southeast while the storm was moving to the east-southeast. Notice the tail clouds streaming into the storm from right to left. These clouds were being absorbed in the lower and middle levels of the storms. The process was distinctly visible as the tails were swallowed up by the storms.

Photo by Craig Johnson, Weather Briefing, L.C.

Above: Here is a close-up of where the tail clouds were being absorbed.

Photo by Craig Johnson, Weather Briefing, L.C.

Above: And here is the rainbow on the north side of the storm. It is being created by the Sun in the west shining into the rain shaft. This series of pictures shows the entire storm from a nearly full image to close-ups of sections of the storm. The storm looked impressive but it was really a rather typical storm for Iowa in June.

June 24, 2022 - Clouds of the Day - Altocumulus lenticularis

Lenticularis clouds have a lens or saucer shape. The shape forms in an air mass that has a series of waves flowing in the wind. When watching water flow over rocks in a stream, you will often see a series of waves form downstream of the rocks. The same thing happens in the atmosphere. Flow over mountains frequently forms lenticularis clouds - waves in the air flow made visible as water vapor condenses into a cloud. It can also happen over flat ground when waves are set up in the atmosphere where the air has formed layers. The flowing air can begin oscillating up and down forming waves that move downstream.

The clouds in the photo above have formed the saucer shape that is common with lenticular clouds. The hump in the middle of the clouds is the top of the wave. If there is enough moisture, there may be a series of these waves visible downstream in the flow, spaced equally apart.

If you take a closer look at this photo, you will notice a series of smaller waves embedded within these lenticular clouds. We have the larger lenticular waves with smaller waves superimposed on the larger waves.

Finally, the complete name of these clouds is altocumulus lenticularis stratiformis. Altocumulus refers to the middle level of the atmosphere where these clouds reside, lenticularis comes from the lens shape of the clouds and stratiformis indicates the waves have formed within what is a flat (stratus-type) formation. The principal cloud type is altocumulus.

June 23, 2022 - Clouds of the Day - Cirrus over the Prairie

Cirrus clouds were smeared over the southern sky this morning. These clouds are cirrus fibratus (fibers) and cirrus spissatus (clumps of dense cirrus), all with streamers (fall streaks) of ice crystals. The clouds moved quickly eastward in a strong flow aloft leaving the deep blue sky that is seen in the background. In many urban areas the deep blue-sky color is seldom seen like it is here. The air over Iowa this morning moved from over the Pacific Ocean across the Central and Southern Rockies and the Great Plains. Scroll down to see the sky clear of clouds.

Photo by Craig Johnson, Weatherbriefing L.C.

Cirrus clouds are made of mostly of ice crystals and stand out in the pristine clear air. Temperatures at cloud level above 18,000 feet were near 16 degrees F. The cirrus below looked like clumps and thin delicate strands of hair. They are also ice crystals.

Photo by Craig Johnson, Weather Briefing, L.C.

Below is how the sky looked after the cirrus clouds moved east. The sky was a deep blue from horizon to horizon with temperatures rising through the 80s to near 90 F.

Photo by Craig Johnson, Weather Briefing, L.C.

Some Science

And finally, the map below shows weather balloon data collected this morning. The upper air station model plots include the temperature in degrees Celsius (upper left of station location) with the dew point depression plotted just below it. For example, the temperature at Omaha, Nebraska, was -9 C and the dew point depression was 24 degrees C. The dew point depression is the difference between the temperature and the dew point. The larger the difference the drier the air. A depression of 24 degrees is very dry air. Look to the east at Davenport, Iowa. The dew point depression was 46 degrees - even drier than Omaha.

The photo above shows the result of the dry air - nothing but blue sky. The upper air over Iowa today is very dry. The cirrus clouds were remnants of cloudiness that was coming out of the southern Plains across Iowa. Dew points reported from balloon measurements west and south of Omaha indicated moisture at high altitude. Some of that moisture, in a small patch, was briefly visible early today over Iowa but it moved east, and the ice crystals sublimated (turned to vapor) into the dry air.

The map below includes the data plotted from balloon (radiosonde) soundings and isotherms (dashed lines of the same temperature. The 16-degree isotherm crosses Iowa.

This map was plotted using Digital Atmosphere, software available from www.weathergraphics.com. Users are able to try out the software at no cost.

Clouds of the Day: Tornadoes?

Photo by Craig Johnson, Weather Briefing, L.C.

The answer is…NO! Even though these clouds may be mistaken as tornadoes they are really rain shafts. Two important features stand out. If you were viewing this in person you would see that there is no rotation. Rain shafts appear to be appendages hanging from the base of a shower or a thundershower, but they are columns of rain falling from the storm. To the left you can see thinner rain shafts that look like a transparent veil. Lightning was not observed at the time this picture was taken so even though it looked like a thunderstorm it had not reached that stage of development. It was a heavy rain shower.

Clouds of the Day - May 12, 2022

Thunderstorms in east central Minnesota are pushing an outflow boundary of cooler air with its leading edge in southern Minnesota. Clouds on the leading edge clearly mark an arc bowing south as it moves toward Iowa. Behind the boundary are a mixture of clouds with the cumulonimbus anvil top of the thunderstorms visible north of the Twin Cities with cirrus blowing off the top into northern Minnesota. Hot air with temperatures in the upper 80s and 90s from Iowa south and southwest to the plains and lower Mississippi River Valley. A band of cumulus clouds is visible from Mississippi and Alabama northward to Upper Michigan.

It takes more than warm moist air to create thunderstorms. The highest temperatures with plenty of moisture are found in the region of clear skies from Iowa southward but there are no storms there. It is the difference in temperature horizontally and vertically that lead to rising motion and thunderstorms.

Clouds of the Day

Thunderstorms in east central Minnesota are pushing an outflow boundary of cooler air with its leading edge in southern Minnesota. Clouds on the leading edge clearly mark an arc bowing south as it moves toward Iowa. Behind the boundary are a mixture of clouds with the cumulonimbus anvil top of the thunderstorms visible north of the Twin Cities with cirrus blowing off the top into northern Minnesota. Hot air with temperatures in the upper 80s and 90s from Iowa south and southwest to the plains and lower Mississippi River Valley. A band of cumulus clouds is visible from Mississippi and Alabama northward to Upper Michigan.

It takes more than warm moist air to create thunderstorms. The highest temperatures with plenty of moisture are found in the region of clear skies from Iowa southward but there are no storms there. It is the difference in temperature horizontally and vertically that lead to rising motion and thunderstorms.

Major Storm Organizing

Low pressure centered in Kansas this morning will move northeast with warmer temperatures on its east side and colder air flowing into the western side during the next 48 hours. Click the map below to learn how to read the station model plots on the map. Pick a station(s) in the middle of the United States and follow the changes in temperature, wind direction/speed, dew point, pressure, and weather as the storm moves northeast. You may follow the storm by using the links to the National Weather Service, Storm Prediction Center, Weather Prediction Center, GOES Satellite, and Radar information on our home page.

Example: This morning at 5:00 a.m. CDT Des Moines, Iowa reports a temperature of 45 F, wind from the SE at 10 knots (12 mph), with a partly cloudy sky. The air pressure was rising but is now falling and is 1009.0 millibars. The air is dry around the storm system this morning but notice the dew point of 55 Shreveport, Louisiana. It indicates low level moisture from the Gulf of Mexico is working its way north ahead of the developing Kansas low center. Watch dew points rise as the moisture spreads north.

To the west dry air with dew points in the 30s, 20s, and low teens in Texas with 6 reported in the northeast corner of New Mexico and single digit dew points across all of that state. High winds and severe weather is likely with this storm. The colder air is still north of the Canada-U.S. border, well behind a cold front from NW Minnesota, to the Dakotas. These air masses will be converging over the central U.S. during the next few days as the storm intensifies and moves toward the Upper Great Lakes.

Map plotted by Digital Atmosphere which is available at www.weathergraphics.com

Awesome View!

Awesome is certainly an overused word but it is one way to describe what we see when looking at Earth from space. One of my favorite university meteorology classes was satellite imagery interpretation. I especially enjoy looking at visible satellite imagery. Visible imagery uses visible light reflected from the Earth’s surface to make the images. The images are essentially what we would see from space.

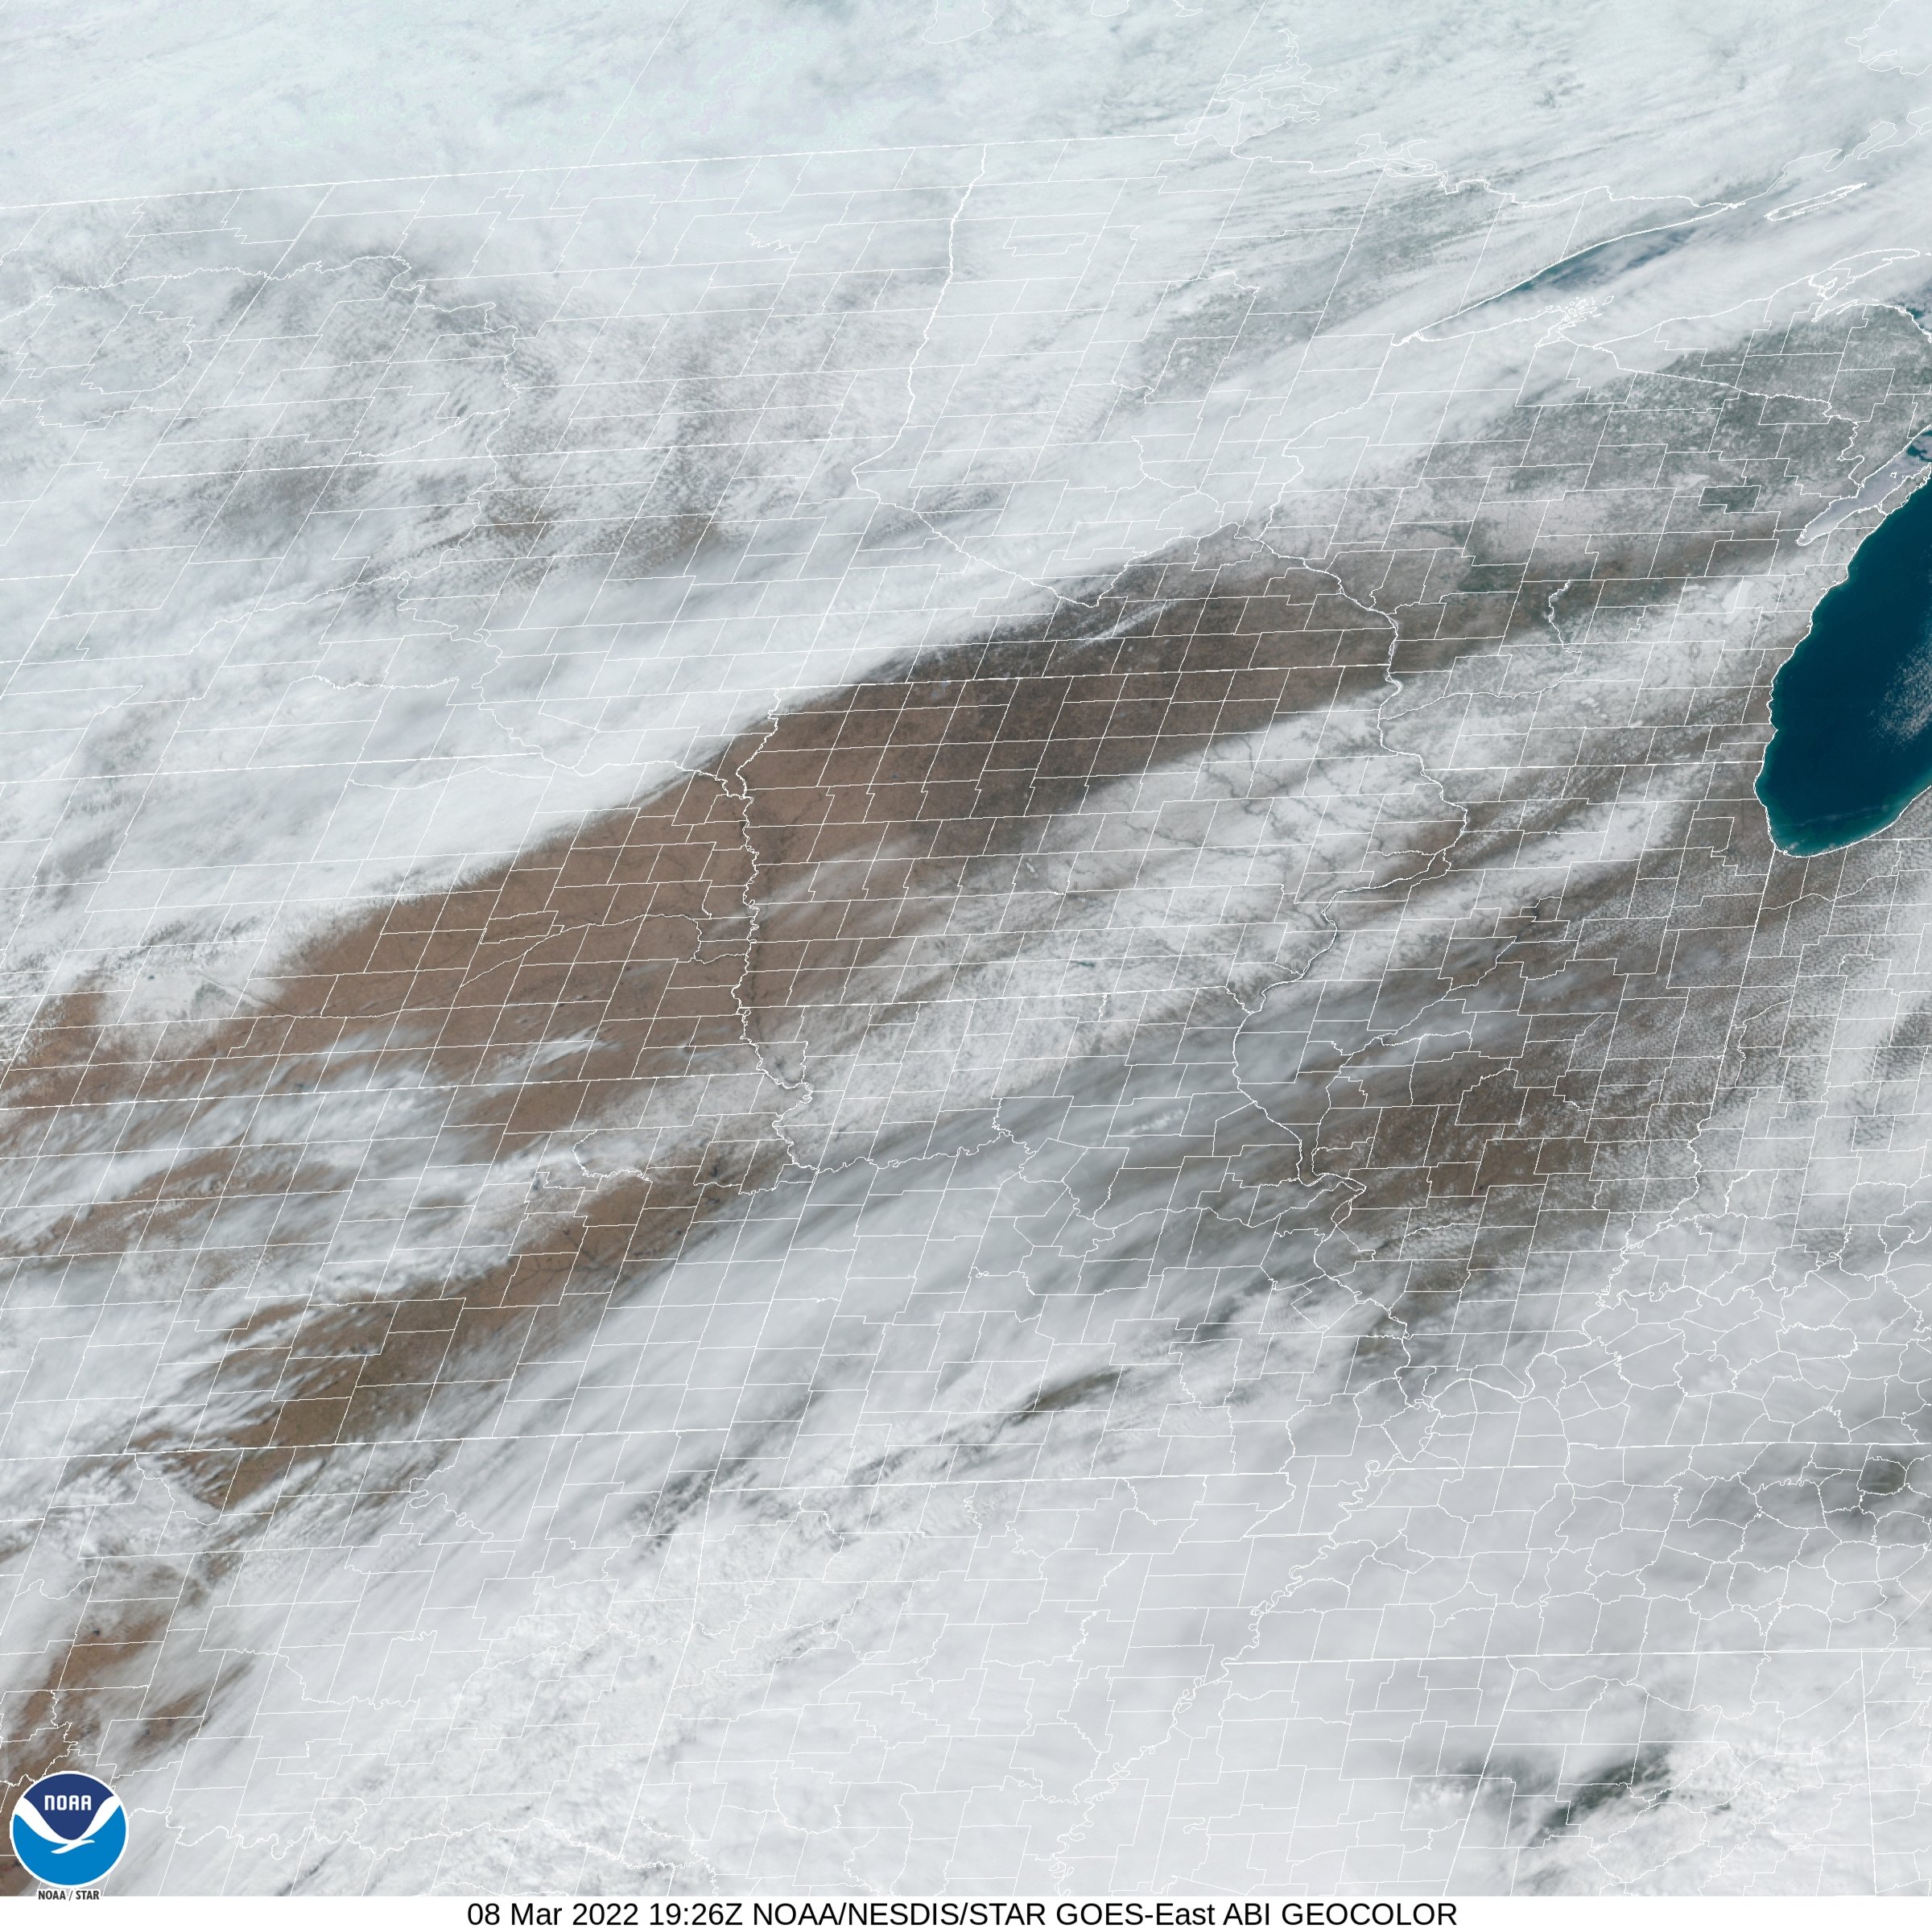
The image below was taken this afternoon by the GOES East Satellite. The time was 1:26 p.m. CST. Clouds cover most of the northwest half of the image - as far southeast as northwest Iowa. To the southeast in a strip from southeastern Nebraska across the southeast half of Iowa to Wisconsin is snow cover from the storm late Sunday into early Monday morning. More clouds are visible from Kansas into all but far northern Missouri before being scattered across Illinois. Breaks in the clouds reveal snow on the ground in Minnesota, the Dakotas, Wisconsin, and Upper Michigan. Notice the river valleys oriented from northwest to southeast in Iowa. The rivers are visible because of the trees and other vegetation that line their banks. The remainder of Iowa is mainly free of snow.

Cedar Falls, Iowa is located in northwestern Black Hawk County near the northwest edge of the snow cover. We received 3.8 inches of snow while other nearby areas reported 4 inches. It is interesting to note how 4 inches of snow looks from space.

Here is a little fun idea: Use the Iowa Rivers Map found here: https://www.mapsofworld.com/usa/states/iowa/iowa-river-map.html to name the rivers you see on the satellite image.

Winter Light Shows

The photos below were taken in January and February. Ice crystals from blowing snow created the sun dogs touching the horizon in either side of the Sun in the first image. The refraction (bending) of sunlight passing through ice crystals created the arcs of light visible on either side of the Sun. The middle photo shows low level blowing snow crossing a county road southwest of Cedar Falls, Iowa. The bottom photo was taken on a day when the air was full of ice crystals that had been swept up by the wind.

Sun Dogs on Friday, February 4, 2022, at 6:20 p.m. CST Near Cedar Falls, Iowa. The arcs of light to each side of the sun are sun dogs. This is an optical effect that occurs when is crystals are oriented to bend light rays toward the camera. The top of the blowing snow is visible above the ground where the hazy appearance of the snow crystals ends. The snow is being picked up from the grouind by the wind.

Frigid sunset with Light Drifting Snow on February 4, 2022 at 6:23 p.m. CST Near Cedar Falls, Iowa

Sun Dog visible on Wednesday, January 5, 2022 at 10:34 a.m. at Cedar Falls, Iowa. The white hazy sky is caused by sunlight being scattered among snow crystals lifted into the air by gusty surface winds. The sundog occurs when the light is bent (refracted) through the crystal at an angle that forms an arc of light.

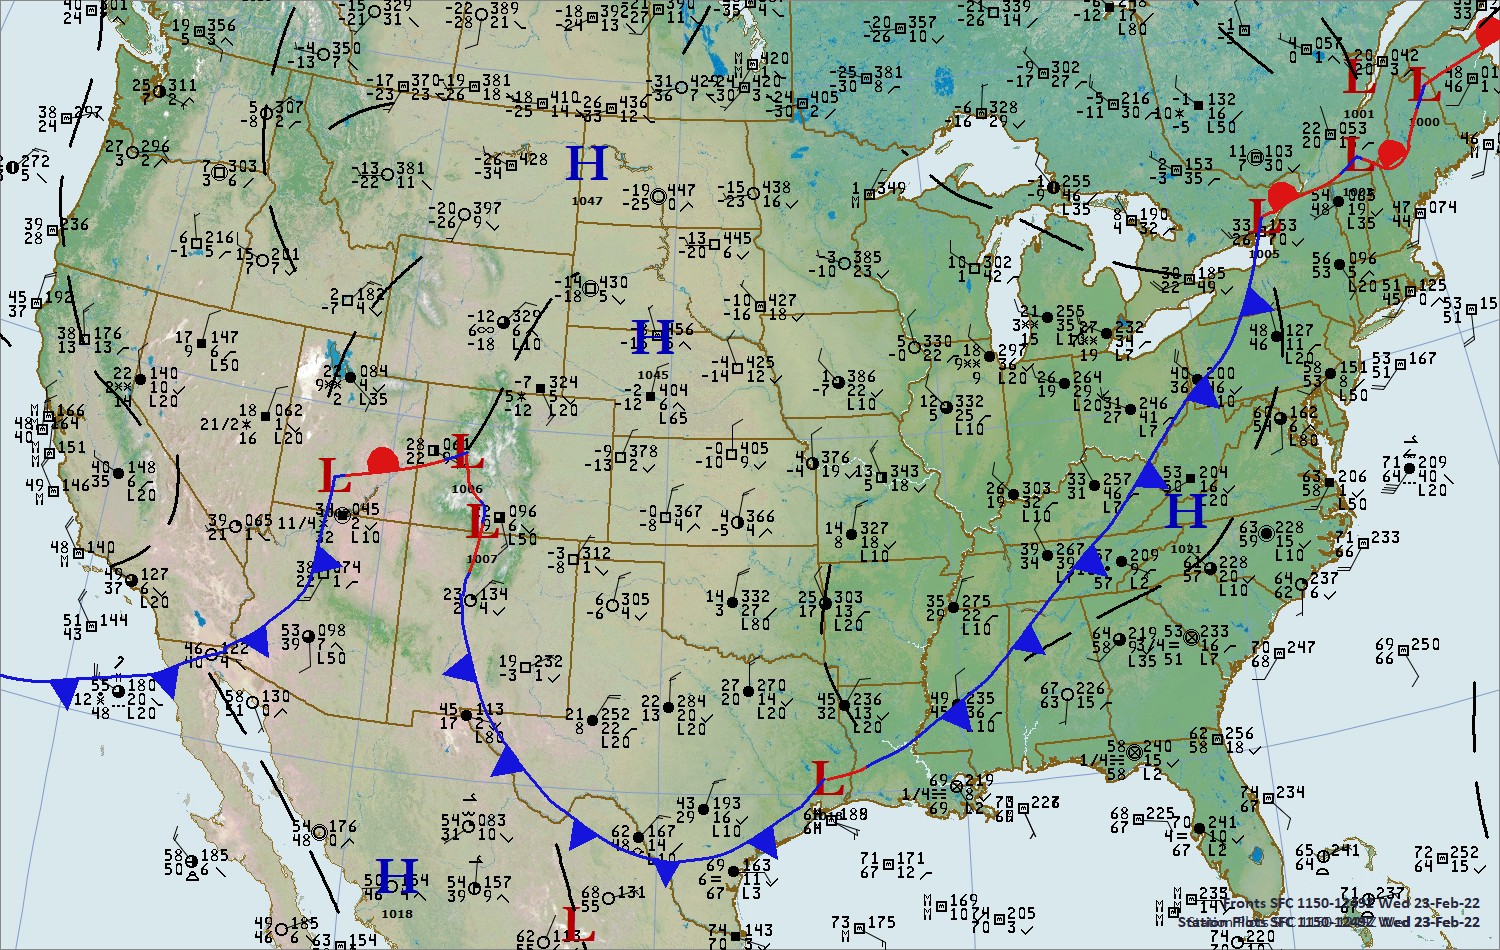
Wednesday, February 23, 2022 at 7:00 a.m. CST

Continuing with decoding station model plots…

Pick out a few cities and decode their station model plots. If this is your first time, the format for how the data is plotted and interpreted will be found on our home page (just scroll down to below the links to the USA weather web pages).

On the above map the Minneapolis temperature is 3 F, dew point is -10, the sky is clear, and the wind is from the west northwest at 10 mph. The pressure has risen 2.3 mb in the past 3 hours. Knoxville, Tennessee reports 57 degrees F with continuous light rain, the dew point is also 57, the sky is overcast, wind is from the southeast and the pressure is 1020.9 millibars. The cloud ceiling is 200 feet. To learn how to decode these plots go to our home page and scroll down to the station model plot section.

Station Model Plots and the position of fronts and pressure centers. Winds along the cold front in the eastern USA are from the south or southwest ahead of the front and from the northwest behind it. Temperatures drop about 20 degrees across the front. High pressure is centered over the Dakotas. Notice that Bismarck, North Dakota reports -19 degrees F. You will notice a -31 reading in southwest Manitoba. In far south Texas notice the report of fog.

Finally, the streamlines this morning show the surface wind directions across the USA. Notice how the air flows away from high pressure centers and toward low pressure. You will see the air around low pressure centers spirals into the low in a counter-clockwise manner. The air spirals clockwise away from high pressure. Air moving toward a common center of rotation implies there is rising motion and air spreading away from high pressure indications sinking motion.

Tuesday, February 22, 2022 at 6:00 p.m. CST

This map shows select station model plots in the United States and parts of Canada, Mexico and nearby areas at 6:00 p.m. this evening. If you are practicing your decoding skills here are some samples:

Rapid City, South Dakota temperature is -5 F, dew point is -11, wind from the north at 10 mph, the pressure is 1040.6 mb and was rising but is now steady. The cloud ceiling is at 2,800 feet. Light snow is reported in southeastern Canada southwestward to Iowa. The coldest temperatures are just north of North Dakota with the warmest readings in the Gulf of Mexico to Florida in the upper 70s with low 90s in southern Texas and northeastern Mexico.

Station Model Plots this evening.

Maps plotted by Digital Atmosphere available at www.weathergraphics.com. If you are decoding the station model plots notice the continuous light snow being reported at Cedar Rapids, Iowa, La Crosse, Wisconsin, Minneapolis, Minnesota, and Brainard, Minnesota. These are examples of how light snow is plotted using the station model format.

Station model plots plus fronts and pressure centers.

This is the same map as above except the fronts and centers of high and low pressure are added.

Which way is the wind blowing?

This map shows surface streamlines - which way the wind is blowing at ground level. Notice how air spirals in toward low pressure and away from high pressure. Clouds tend to form in areas where the air is flowing together (streamlines converging) and dissipate where the air flow is spreading out (diverging). Of course, that is not true 100% of the time but that is a story for another time. This map is another plot from the Digital Atmosphere software.

Monday, February 21, 2022 at 8:00 a.m. CST

Commentary is coming later but for now here are two maps from this morning showing the storm we are watching. The first map includes only the station model plots. The second map shows the surface analysis with fronts and areas of high and low pressure superimposed. The first map gives you a clean look at the data. Read last evening’s post for instructions and then pick a few cities to follow and compare the observations from last evening to this morning.

The station model plot format is on our home page. Notice temperature, wind, and cloud cover How have they changed since last night? This is a large slowly developing system so the changes will be slow.

Maps plotted using Digital Atmosphere available at www.weathergraphics.com

Here is the same map with the fronts and pressure centers located. In general, we are looking at a very large mass of polar/arctic air sprawling south from Canada into the north central U.S. Warmer air is moving northward and overrunning the cold air. This will eventually lead to precipitation in the form of rain, drizzle, freezing rain and freezing drizzle and snow in the cold air. Pick a few cities and follow the weather changes as the storm develops.

Next let’s check a few cities and see what the Station Model Plot has to say about their weather.

Amarillo, Texas: 51 degrees, dew point 10 degrees. Wind from the southwest at 15 mph. Pressure is 1004.1 millibars (mb), sky is clear.

Des Moines, Iowa: 35 degrees, dew point 29 degrees, Wind from the east at 5 mph and the pressure is 1008.9 millibars.

Bismarck, North Dakota: -7 degrees, dew point -14 degrees, wind from the northeast at 15 mph, light snow, and overcast with IFR celing

Weather Arriving from all Directions

Air masses are coming together in the middle of the country. Follow the changes while practicing your decoding of station model plots of local weather. We will start with this weather map from Sunday evening, February 20, 2022, at 10:00 p.m. CST and update with later maps as the storm develops.

This is a very interesting map because the weather is very busy. Behind a cold front dropping south into the north central U.S., temperatures drop off quickly from the 50s over southern Iowa to below zero in southern Canada. Check the station model format on our home page and decode the temperatures. Watch for rain, freezing rain and snow to develop over the central U.S. during the next 24 to 48 hours. We will follow it here so you can practice your decoding skills while following a storm. Pick a few cities and follow their weather.

A broad area of low pressure is located over the Intermountain Region (Utah, Nevada) to the central Plains (Nebraska, Kansas). Southerly winds are blowing from the Gulf Coast north to Kansas and Nebraska and northeast to the lower Great Lakes. Notice the north and northeasterly winds over the Northern Plains (Montana to the Upper Great Lakes. There is a general counter-clockwise air motion over the central Rockies west to Utah as mild Pacific air spreads across that area and southerly winds move north from the Gulf. At the same time cold air is spreading southwestward toward the low pressure from the upper Great Lakes to the Northern Plains. This combination is the counter-clockwise flow spreading toward the area of low pressure in the central Rockies.
Map plotted using Digital Atmosphere available at www.weathergraphics.com

The dashed red lines are isotherms (lines of constant temperature). They are closest together in the cold air. In the warmer air temperatures increase to the mid 60s toward the Gulf coast. Each dashed red line (isotherm) represents a 2-degree F change in temperature. Isobars are the solid black lines of equal pressure. The wind speeds tend to be stronger where the isobars are close together and weaker where the isobars are farther apart.

You will need to know the station model format which can be found on our home page in order to decode the observations. Start by looking at the temperatures at different weather stations and also the wind and the air pressure readings. When you look at this map imagine that the air is coming together from all directions over the central Rockies. That is what is happening. More on this tomorrow.

Tracks of a Snowstorm!

Satellite imagery puts it all in perspective. Here is the GOES visible satellite image on Friday, February 18, 2022, at 12:01 CST. The images shows a large part of North America including Mexico and Central America, the United States, and southern Canada. While we see the clouds there is also a noticeable band of white from northern Oklahoma across southeast Kansas, Missouri, the southeast corner of Iowa, central and northern Illinois and on to the lower Great Lakes. This is the path of the last snowstorm - the track of the storm!

A closer view of the track below this image shows where trees and lakes, which are not snow covered, show up as darker areas. They are easily identified.

GOES image courtesy of NOAA/NESDIS/STAR

Notice the distinct band of snow cover from northern Oklahoma northeast to Indiana. Within the band we can see the location of rivers - especially in Illinois and Missouri. To the north there is a band of clouds from South Dakota and southern North Dakota across southern Minnesota into Wisconsin. Most of the white (not all) over northern Iowa is snow cover. Snow cover is also visible in northern Minnesota and if you look closely you will see distinctly denser areas of white in northern Minnesota that is ice and snow cover over the larger lakes in that area. The Upper and Lower Red Lakes are visible as is Leech Lake. Truly remarkable imagery!

Image courtesy of NOAA/NESDIS/STAR

Clouds of the Day - Wednesday, January 5, 2022

Sun Dogs on Display

We had sun dogs on display for most of the morning today. Very fine ice crystals formed when strong winds blew snow into the air pulverizing snow flakes into tiny ice crystals. The Sun is on the right side of this photo and a Sun Dog formed as an arc to the left when sunlight was bent (refracted) by the ice crystals. The blowing ice crystals and stratus clouds are seen in this photo (more on sun dogs later).